New Rules for Old Roads
Updated safety methodologies can protect cyclists, walkers, and scooter riders on urban streets designed for cars.
Recent shifts in technology and culture have transformed the traffic on urban streets in the United States, bringing walkers, runners, bicyclists, and people riding new devices such as dockless scooters onto throughways designed primarily for motor vehicles. From 2017 to 2018, trips on bikes and scooters doubled to 84 million. In 2016, the number of persons biking to work was 50% higher than in 2005.
Between 2007 and 2017, driver fatalities in the United States declined by 14%, while pedestrian deaths rose by 27%.
This trend has only accelerated with the COVID-19 pandemic, particularly in urban areas, as people have shifted from transit to active and inherently socially distant modes. As early as March 2020, use of Philadelphia’s trail network jumped 150% over 2019 levels. By May, cycling trips in Houston and Los Angeles were up 138% and 93%, respectively, from the previous year.
Increasing numbers of cyclists, scooterists, and pedestrians sharing the rights-of-way with vehicles have too often resulted in conflicts and crashes. Between 2007 and 2017, driver fatalities in the United States declined by 14%, while pedestrian deaths rose by 27%. The year 2018 was the deadliest year for cyclists on record, with fatalities rising 10% over the previous year. Although data are still being collected, cities are reporting steady or higher pedestrian fatalities during the COVID-19 pandemic compared with previous years.
The current safety regime, which privileges the safety and needs of automotive users above other roadway users, relies on retroactive data that make it difficult to shift safety priorities.
It is clear that more needs to be done to safeguard the growing population of nonmotorized travelers. The current safety regime, which privileges the safety and needs of automotive users above other roadway users, relies on retroactive data that make it difficult to shift safety priorities. To better protect all travelers on busy streets, the nation needs to look critically at how safety is currently defined and quantified, and how that definition could be optimized to be more inclusive and more proactive to create better plans for urban transportation safety.
An old, flawed safety metric
Safety is defined differently in different transportation sectors. The urban transportation system takes a reactive approach by measuring and improving safety after crashes and fatalities occur, but other fields, including air transportation, use more proactive approaches. Examining these two approaches suggests a methodological agenda to proactively measure—and improve—safety in the urban environment. We suggest integrating authentic user experiences into a more comprehensive and proactive paradigm.
The High Injury Network map for Philadelphia includes only 12% of the city’s streets yet accounts for 80% of all killed and injured.
In practical terms, the current gold standard measure of urban transportation safety is known as “killed or seriously injured” in a crash, or KSI. Aggregated KSI statistics are typically visualized in the form of High Injury Network maps that highlight corridors with the highest frequency of crashes. Figure 1 presents the High Injury Network map for Philadelphia; this network includes only 12% of the city’s streets yet accounts for 80% of all KSI.
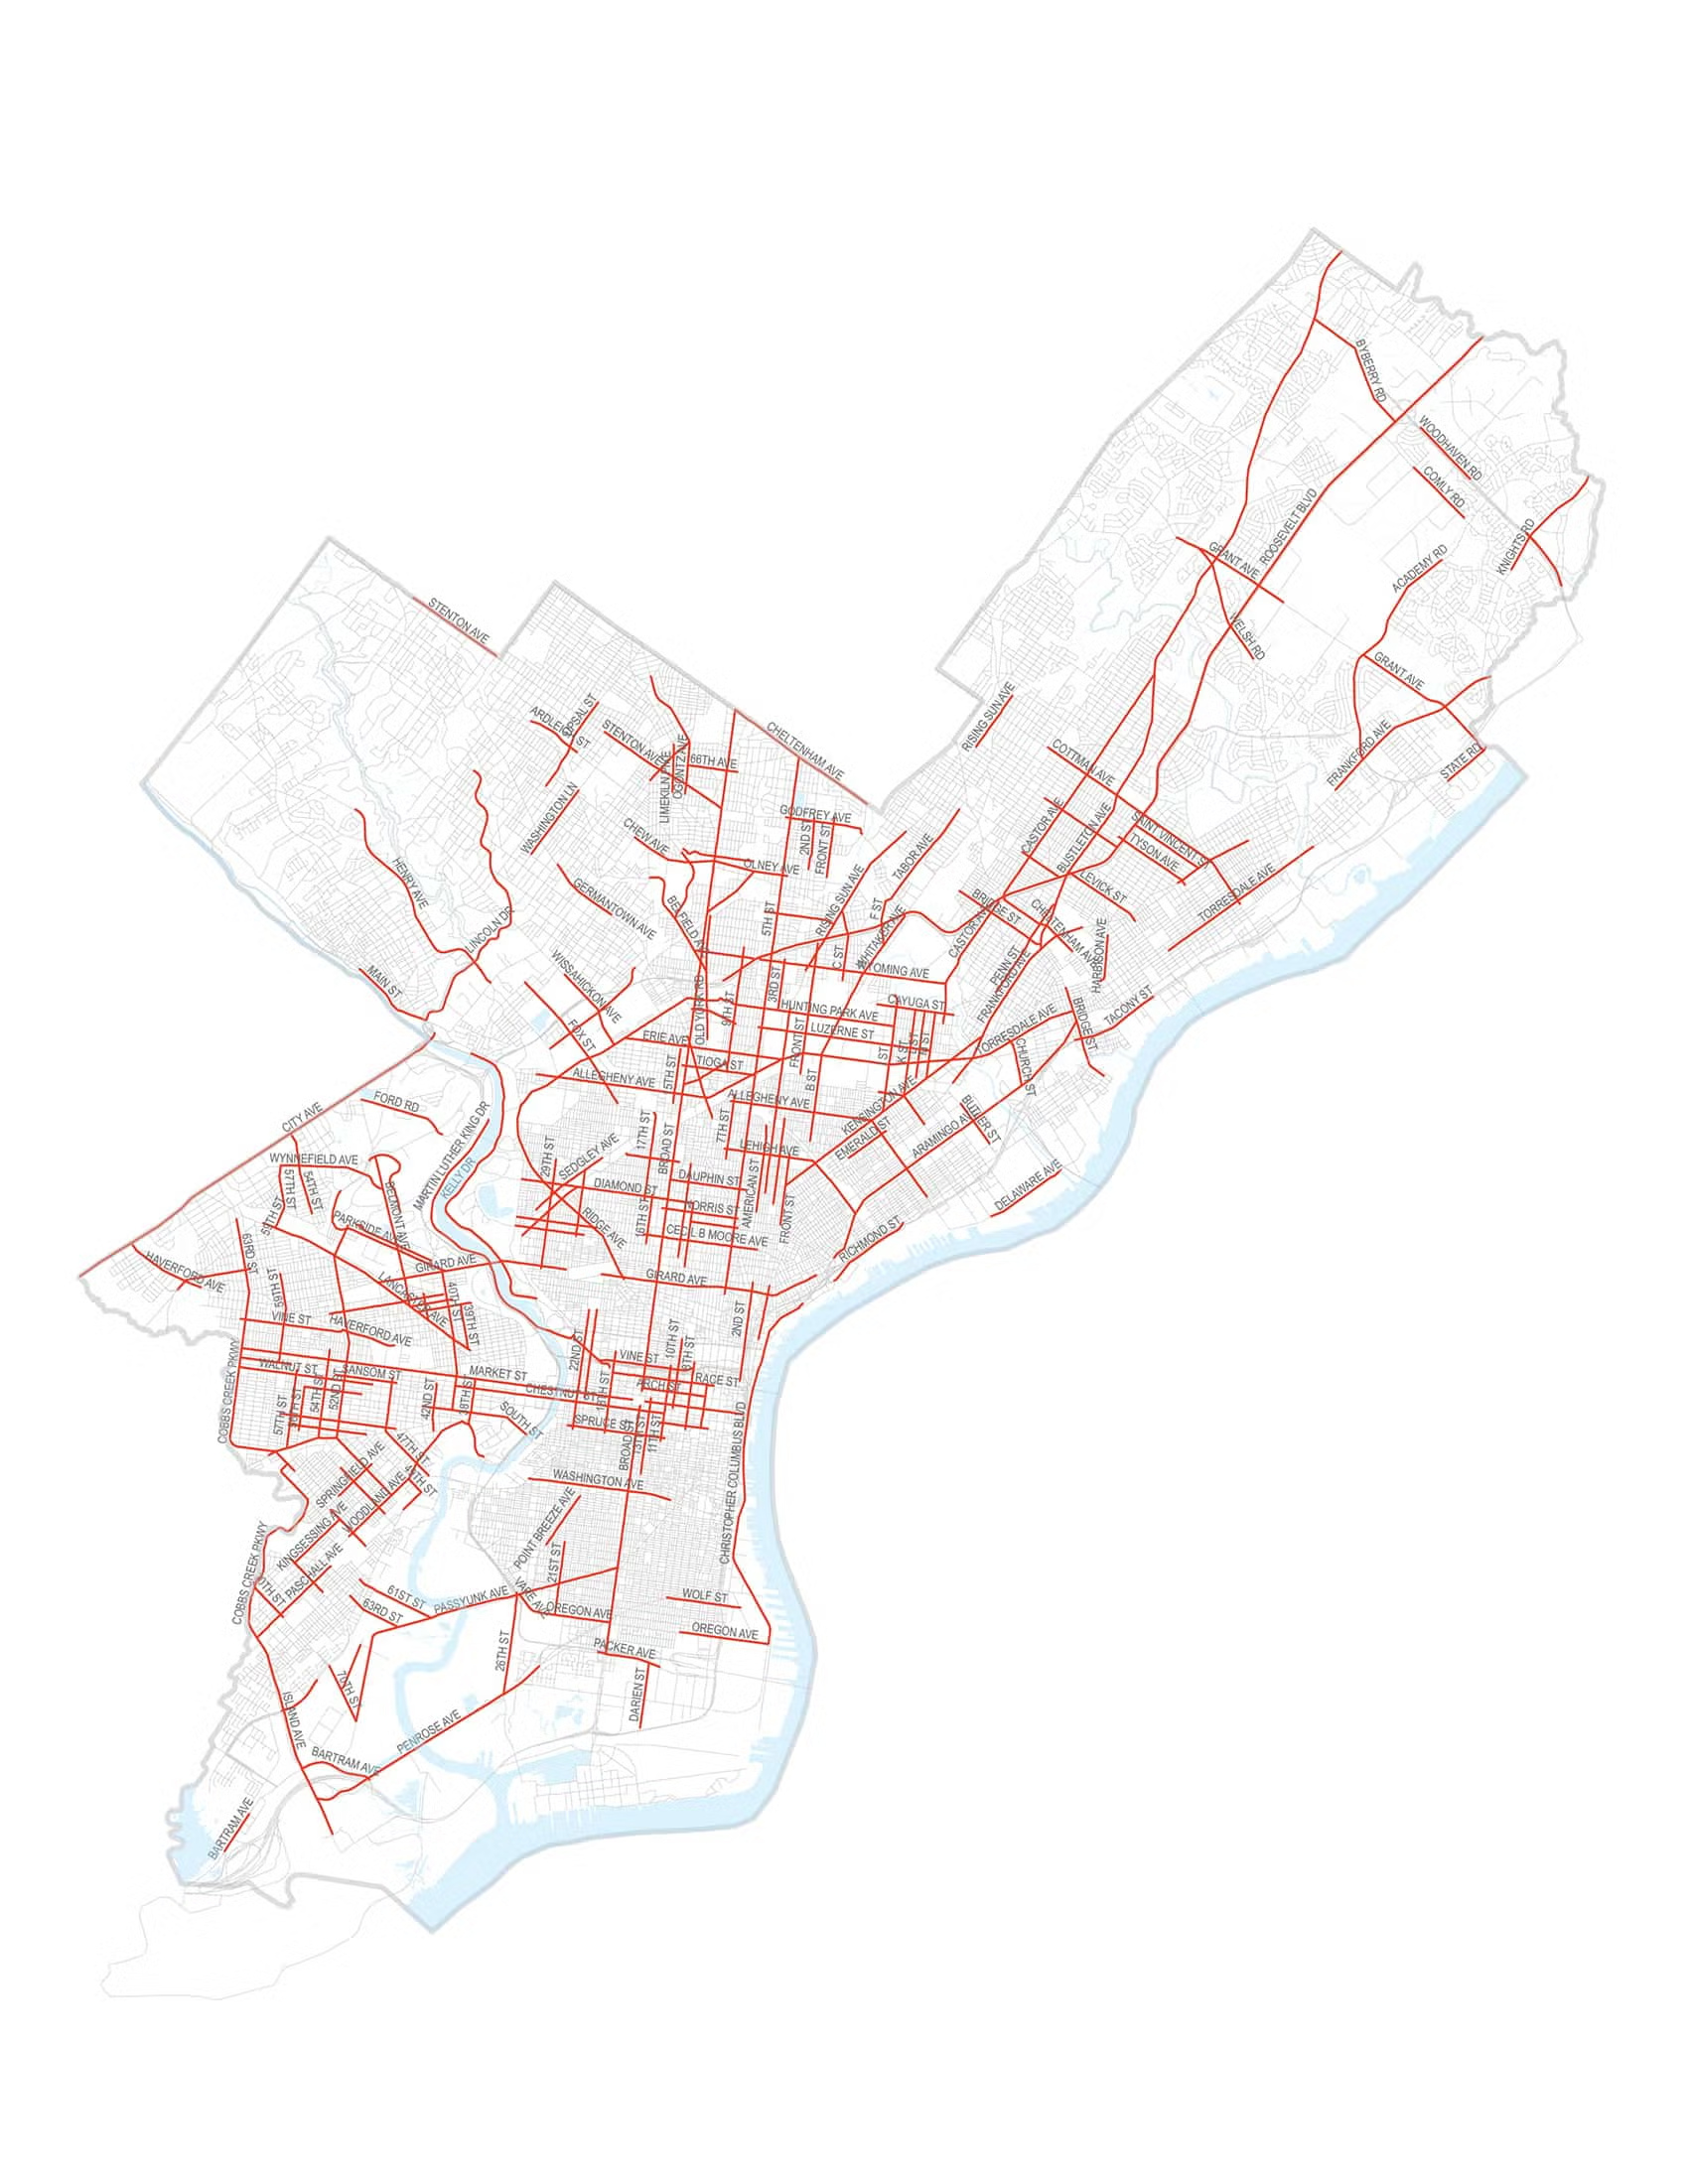
Credit: City of Philadelphia, Office of Transportation, Infrastructure & Sustainability
Click the image to expand.
KSI is sometimes expressed as a sheer count, and sometimes is augmented with the perspective of travelers through surveys and focus groups. However it is determined, KSI is a critical metric: safety interventions can be deployed only if KSI values exceed a given threshold. For example, in order to deem a crossing location unsafe and eligible for an upgrade of crossing and lights, the standards require that either “at least 93 pedestrians must cross at the location every hour” or “five pedestrians were struck by vehicles” within the last year. The document that sets these standards—the Federal Highway Administration’s (FHWA) Manual on Uniform Traffic Control Devices (MUTCD)—sits atop the hierarchy of safety guidance and is the final word in street and traffic device design; states and local entities can set their own regulations, but any measures must meet the requirements of the MUTCD.
In order to deem a location unsafe and eligible for an upgrade of crossing and lights, the standards require that either “at least 93 pedestrians must cross at the location every hour” or “five pedestrians were struck by vehicles” within the last year.
Despite the authority given the KSI, it is a flawed metric. To begin with, it doesn’t count crashes that don’t occur. According to simulations by FHWA, there are 20,000 near- misses for every crash. And even then, actual crashes and fatalities are so notably underreported that there is an extensive body of literature dedicated to modifying counts from police and medical records to more completely reflect the real total.
In addition, as every pedestrian and cyclist knows, even accurate counts of injuries wouldn’t adequately explain the true nature of a risky intersection. People wisely avoid crossings they perceive to be unsafe, which means they do not have the chance to be struck and killed or injured. But if no one is struck at a location, there is currently no evidence-based mechanism to identify that crossing location as unsafe.
This exclusive use of such after-the-fact measures of fatalities means not only that many unsafe intersections remain that way, but also that there is very little nuanced data on the safety of all the potential traffic safety countermeasures that could be employed. These measures include visual cues such as painted crosswalks and bicycle lanes; separators where modes are channelized by striping, physical barriers, or curbs; and signalized improvements such as pedestrian priority and bicycle-detector signals at intersections—all of which are described by guidance from the National Association of City Transportation Officials (NACTO), which is widely recognized for urban street design recommendations. Although NACTO provides comprehensive documents of design recommendations, the questions of when to implement a safety intervention and which design will yield the most benefit in a specific location still hinge on the flawed and incomplete KSI metric.
In contrast, air transport is the one travel mode where safety is proactively measured. The potentially dire consequences—including loss of life—for unsafe air travel, combined with the high publicity given to airplane crashes, make it politically infeasible to measure air transportation safety as a function of KSI. Instead, the Federal Aviation Administration estimates the cognitive workload of air traffic controllers responsible for keeping aircraft safely separated and managed. Safety is thus measured in advance by evaluating the range and diversity of tasks that controllers can mentally handle and then designing the air transit system accordingly.
Measuring safety with fresh eyes
To an extent, roadways are already planned based on proactive safety metrics. FHWA, NACTO, and the American Association of State Highway and Transportation Officials (AASHTO) measure safety from the perspective of the driver by estimating cognitive workload. These studies are based on the idea that the cognitive workload of drivers can be measured through biometric sensors that collect data on heart rate, skin conductance, and respiration rate, along with eye-tracking glasses that collect data on blinking, staring, and pupil dilation and rotation. High cognitive workload is associated with more driving mistakes.
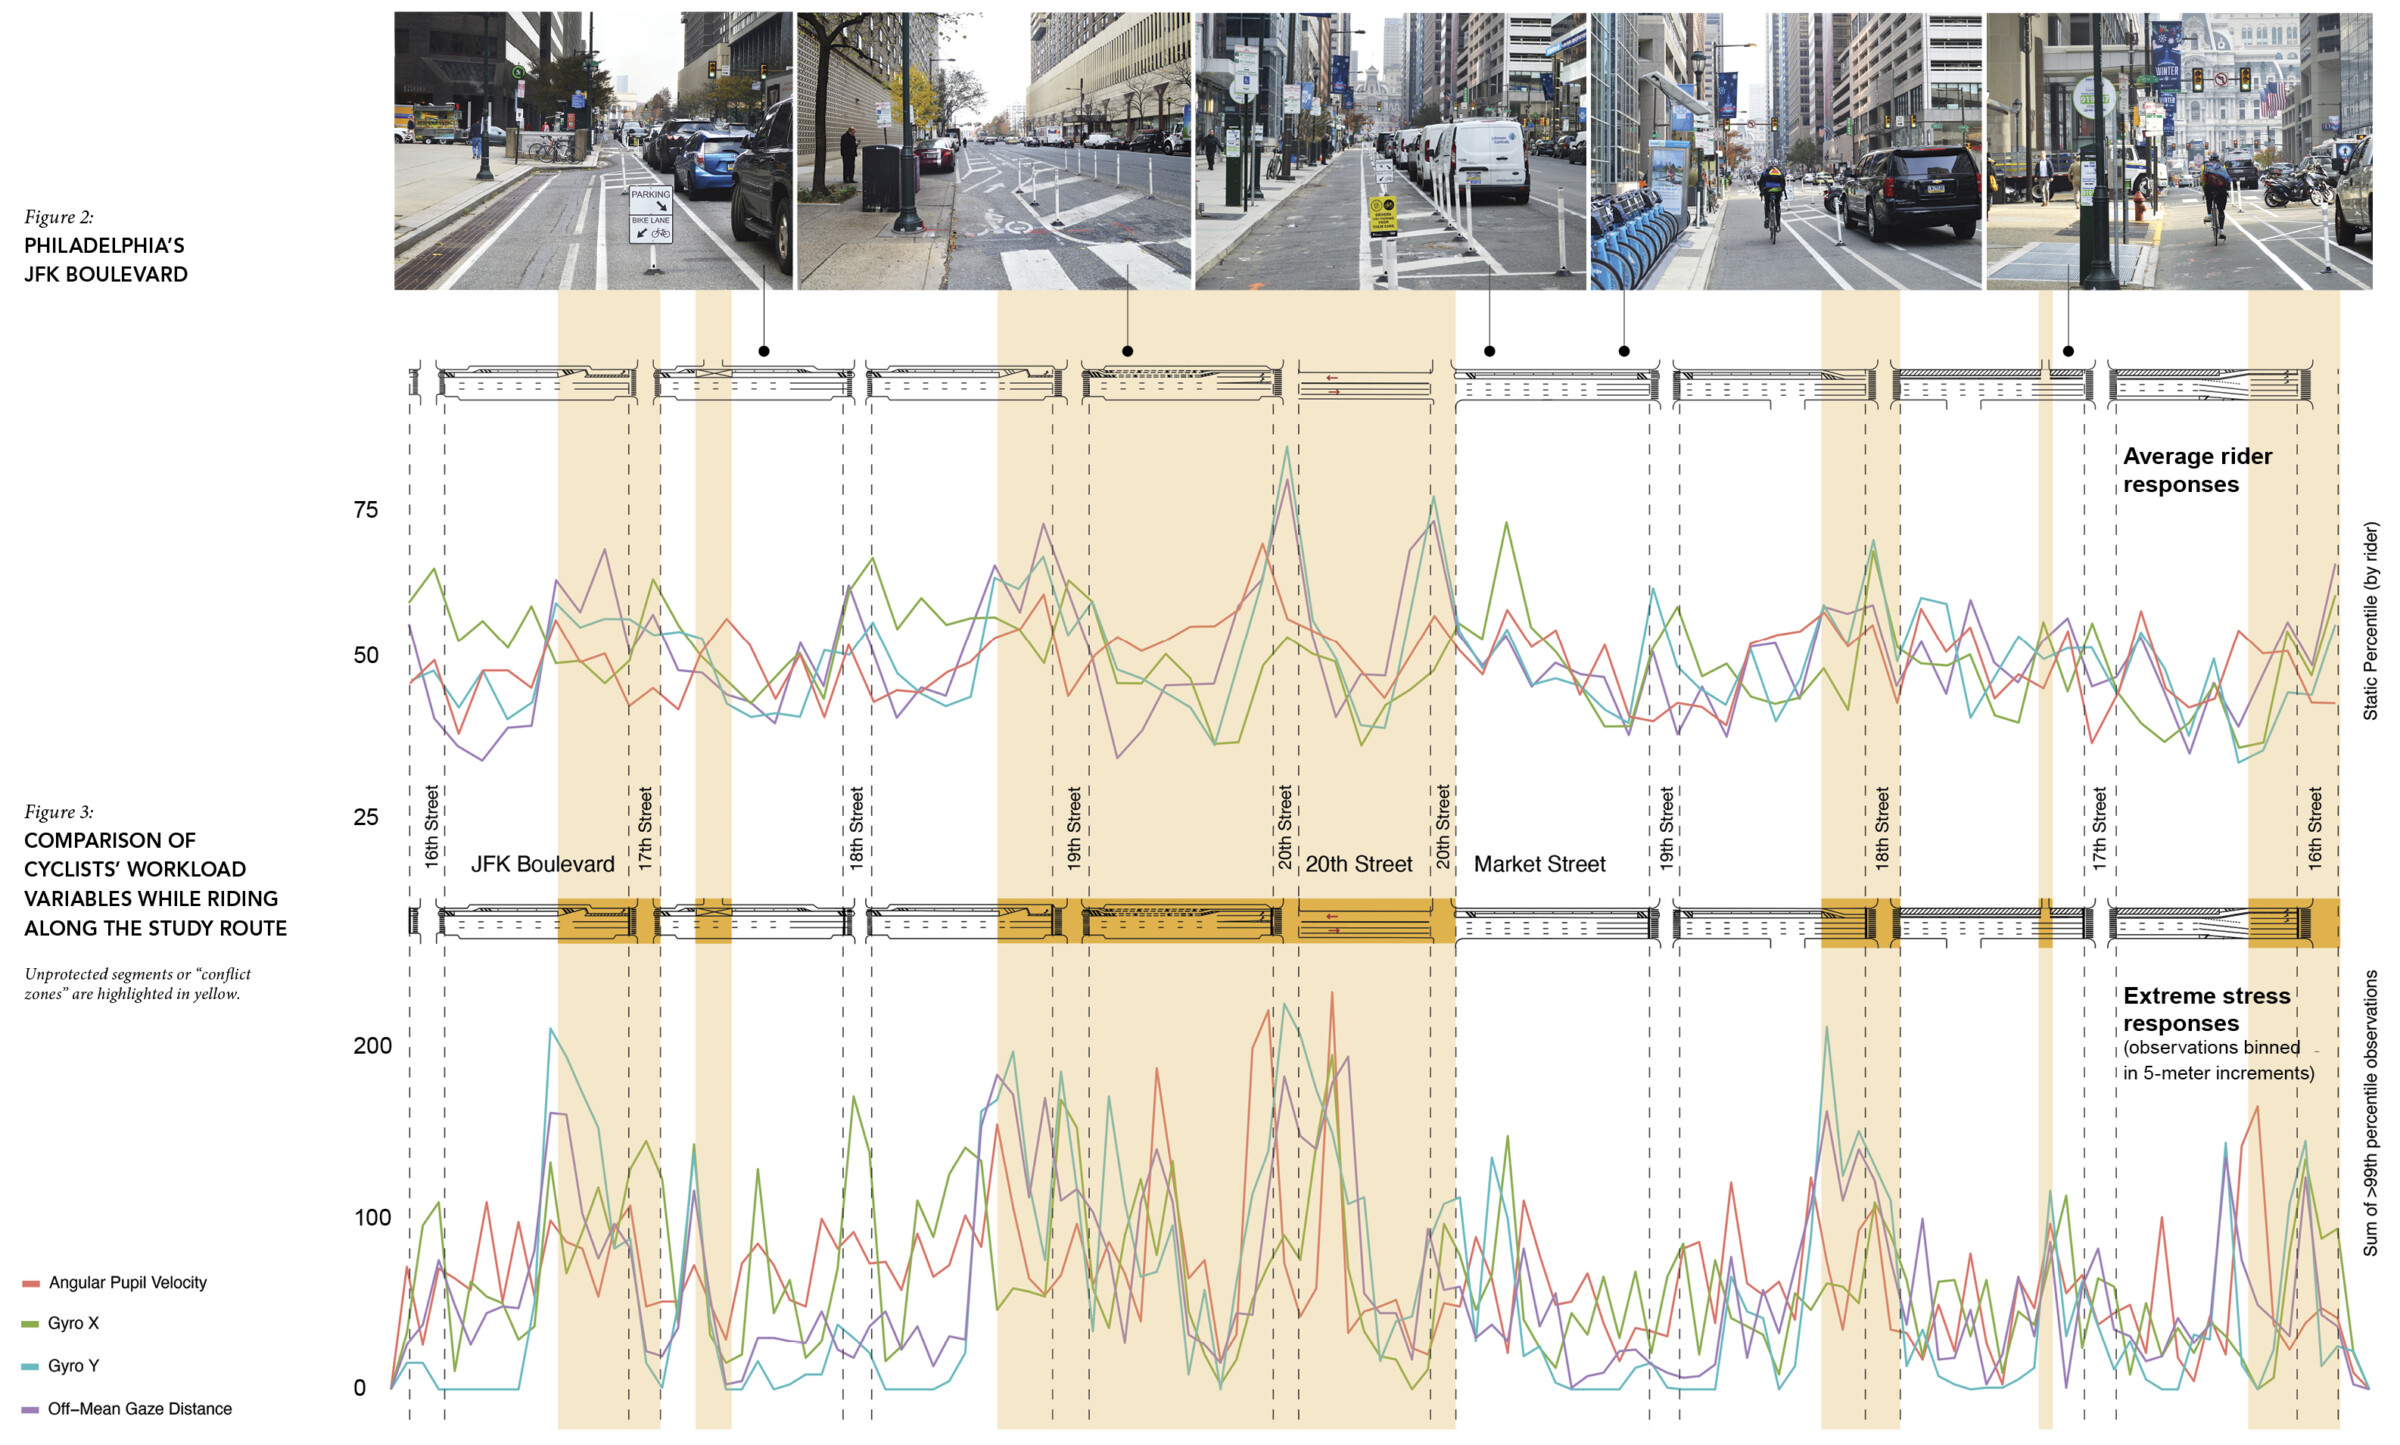
Figure 3. COMPARISON OF CYCLISTS’ WORKLOAD VARIABLES WHILE RIDING ALONG THE STUDY ROUTE
Click the image to expand.
These attempts to measure cognitive workload are the foundation of the rules that govern the layout of the nation’s roadways. Different layouts that adhere to these rules are presented in the federal-level manuals that provide mandatory guidance for roadway design. However, this approach centers too heavily on motorist behavior and perspective with the aim of avoiding crashes, rather than prioritizing safer travel and fully considering the experience and perspectives of cyclists and pedestrians.
It is time for new perspectives and new methods to plan safe urban transportation systems for all users. These new methods must be both proactive, measuring safety from the user perspective without relying on crash data, and continuous, allowing for comparative analysis before and after interventions.
By outfitting pedestrians and cyclists in the field with eye-tracking and gyroscope technologies and capturing their movements, researchers can collect data about their experience as they traverse different urban infrastructure designs and traffic levels. Biometric data on the cognitive workloads of pedestrians and cyclists would aid in developing new metrics for safety. For example, by comparing the experience of cyclists in protected versus unprotected bike lanes, it will be possible to directly evaluate users’ experiences across different infrastructure designs.
Figure 2 shows JFK Boulevard westbound in Philadelphia, a street used in our research to test the relationship between various infrastructure designs and cognitive workload for cyclists. The areas highlighted in orange are “conflict zones” where cyclists are not protected from traffic. Areas not highlighted feature extra protections such as bollards or parked cars, or both, that physically separate cyclists from traffic.
We then used data gathered from eye-tracking glasses to link micro behavior to infrastructure designs, accounting for rider differences. We find a general pattern of higher stress in the conflict zones such as intersections and areas without bollards. Figure 3 shows two plots arranged with the street map. The top plot shows the average rider responses, and the bottom plot shows the extreme stress responses for riders at each point in space. We measured these stress responses using four different variables: how fast the eyes are moving; how much a cyclist moves his or her head to glance over either shoulder or to look up and down; and the distance the pupil moves away from the typical pupil position. The average stress response—the average readings of all these variables—is highest when cyclists are mingling with cars. Moreover, we find that of all the extreme observations experienced by the cyclists, the largest share is experienced when they are in the conflict zones mingling with cars.
Using these measurements, we are able to clarify the relationship between facility design, cognitive workload, and safety. Our research sets the foundation for a methodology to change infrastructure to create safer streets for all users.
Shifting how safety is designed
Collecting and analyzing biometric data from nonmotorists would shift the way safety is measured by the entire transportation and public health community—with implications for infrastructure policy and design.
Collecting and analyzing biometric data from nonmotorists would shift the way safety is measured by the entire transportation and public health community.
This approach will fundamentally change the way safety countermeasures are designed, evaluated, and prioritized by federal, state, and local transportation authorities. The agenda we propose shifts the character of roadways to become spaces not solely for automobiles but shared by diverse users. In urban policy, such new design guidelines and safety intervention manuals should be informed by collecting real data from pedestrians and cyclists. In urban design, these results can be used, for example, to recommend painted bike lanes and signals as safety interventions where cyclists, pedestrians, and others feel the most stressed or unsafe.
In this moment of dramatic change in the nation’s transportation systems, networks, and travel patterns—with growing demand for safe, active transportation—policy-makers must rethink how public infrastructure is planned and designed to adapt to and serve more people.