How Some Universities Translate Inclusive Innovation Into Regional Growth
Positioning universities as hubs of inclusive innovation, particularly in less inventive places, can shift local workforce demographics and accelerate growth.
The American innovation economy, for all its ingenuity, does not engage large segments of the American public. Studies show that an individual’s chances of becoming an inventor in the United States are strongly linked to their socioeconomic class, race, and gender. As recently as 2019, women made up less than 13% of US inventors with patents, and only 18% of US businesses with patents are women-owned. White inventors filed patents at three times the rate of Black inventors. And our research has shown that innovation is highly geographically concentrated; between 2016 and 2020, 57% of all patents produced in the United States originated in one of the top ten economic areas for patent activity, such as Silicon Valley, the Boston area, Houston, and Detroit.
Patenting data are by no means the only measure of innovation, but they are a good proxy for the engagement of individuals with inventive ideas that may grow the economy. Disparities in engagement mean fewer good ideas and lost productivity. These gaps can be addressed by creating opportunities for more individuals and communities to participate. The US Patent and Trademark Office’s National Strategy for Inclusive Innovation, the National Science Foundation’s Regional Innovation Engines program, and the Economic Development Administration’s Regional Technology and Innovation Hubs all aim to boost more inclusive growth for American innovation across the country. These and other efforts would benefit from a closer look at a bright spot for fostering invention activity, particularly among women: leading US universities.
The American innovation economy, for all its ingenuity, does not engage large segments of the American public.
Universities are key institutions for regional innovation, although their influence varies widely. They are critical nodes in regional innovation ecosystems for many reasons, but notably because they train talent across scientific and technical fields with the potential for high patenting activity. PhD students in science, technology, engineering, and math (STEM) fields—especially those with an opportunity to work alongside their university faculty’s top innovators—are likely to become new inventors themselves and to continue contributing important ideas throughout their careers in academia or industry. The impacts of universities as innovation nodes are amplified when patenting activity is focused in fields that are closely related to the industrial strengths of a region.
Our recent work suggests that universities also play a particularly important role in supporting women inventors and entrepreneurs in their regions. More women have been getting patents over the last several decades across the United States, but the rate of change has increased faster for women inventors training or working at universities. Women represent 17.3% of new (first-time) inventors in the United States but 26.3% of new inventors at US universities (Figure 1). This tells us universities play a disproportionate role in enabling women in innovation.
Figure 1. Share of female new inventors at universities
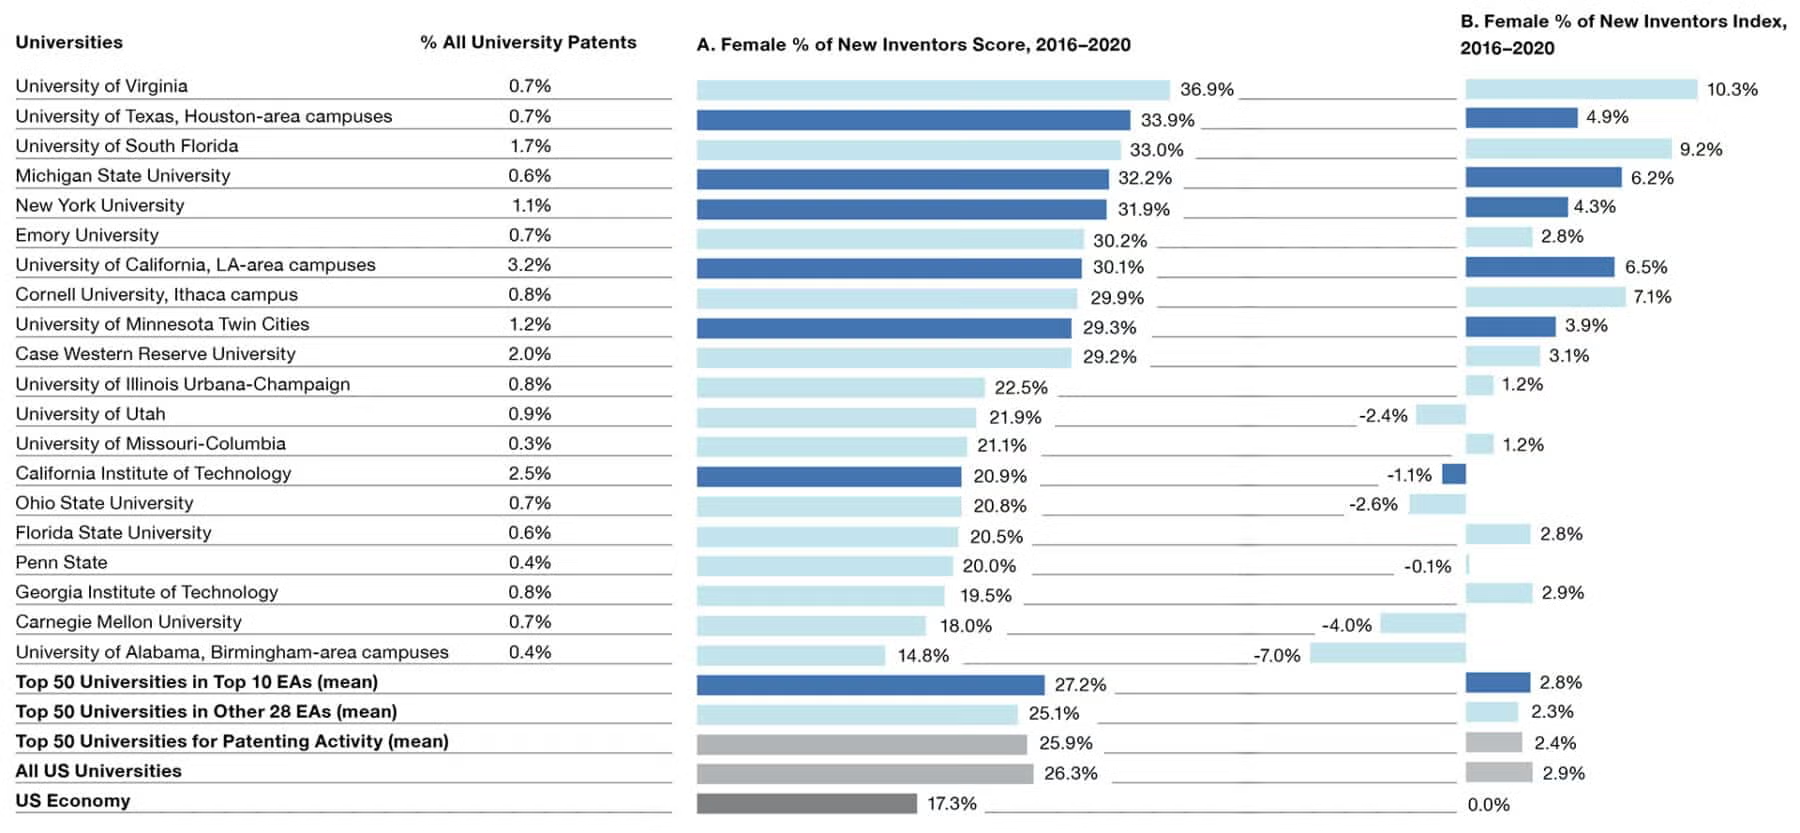
The percent of new inventors who are female at 20 of the top 50 universities for patenting activity. Column A shows the values for each university ranked in the top and bottom 10 of our sample. Column B shows an index value to account for each university’s patent technology class composition (a negative value means underperforming the US economy). Some universities that perform poorly based on the score perform well in the index (e.g., Georgia Institute of Technology, Florida State University) because they have more patenting in fields where fewer women are represented across the economy. Dark blue indicates campuses located in the top 10 patenting economic areas (EAs) in the United States; light blue labels campuses outside the top 10 areas.
Some universities play this role better than others. To highlight which universities are having the most positive impact on training female PhDs and inventors and to encourage underperforming universities to adopt promising practices for supporting female students and inventors, we developed a scorecard (Figure 2). It appraises 50 leading US universities and university systems in 38 economic areas. Together, this set of universities produced more than 54% of the STEM PhDs and over 68% of the university patents granted in the United States between 2016 and 2020. We find significant variation in performance across universities.
Figure 2. Scorecard for universities’ potential contributions to regional inclusive innovation
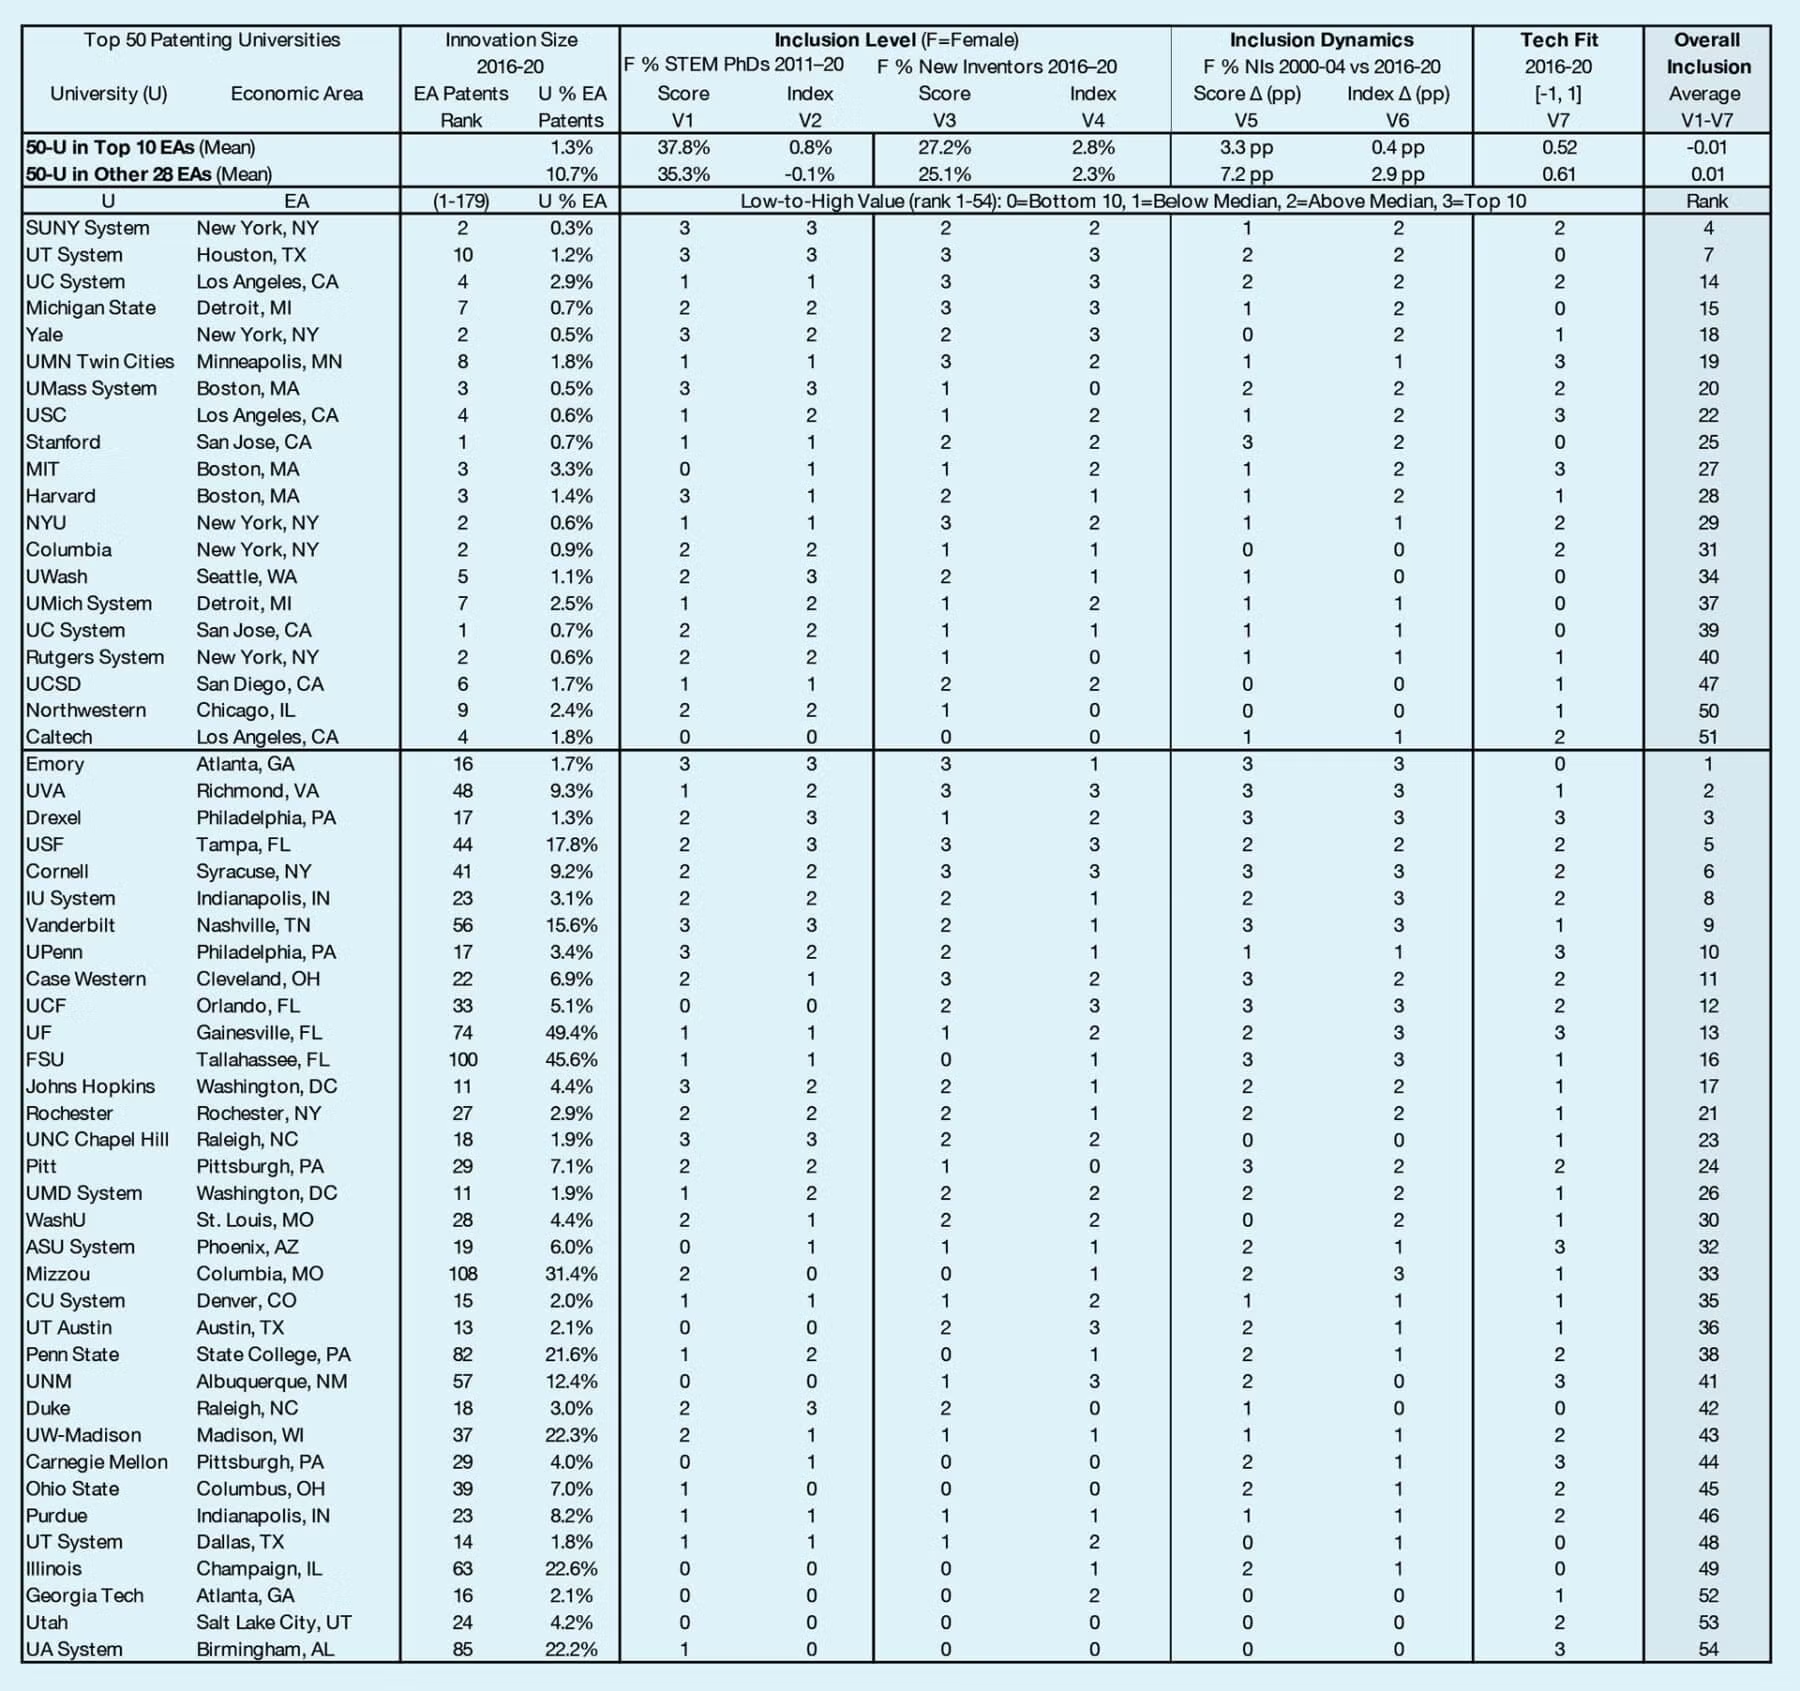
Universities (U) located in top 10 economic areas by patenting activity are separated from universities outside the top 10 areas, and ordered in both sections by Overall Female Inclusion Rank (1–54). The rank is computed based on the mean of the (standardized) continuous variables (V1–V7). Some university systems have campuses in multiple economic areas (e.g., the University of California system and the University of Texas system), and some university systems have more than one campus in the same economic area (e.g., UC System in the San Jose economic area includes UC Merced, UC Berkeley, UC San Francisco, and UC Santa Cruz). A full description of the methodology and the university values/ranks for each variable can be accessed here: https://tinyurl.com/universityinclusion2025
Our analysis focuses on the inclusion of women in innovation at universities. But examining the inclusion of other groups underrepresented in the STEM pipeline and in patenting is likely to yield similar insights. Better patent demographic data is needed to broaden our analysis.
Our “scores” for each university consider three measurements of inclusive innovation: STEM PhDs awarded to women as a percentage of total STEM PhDs; female new inventors as a percentage of all new inventors; and change in the female share of new inventors over time. In every case we look at absolute levels and provide a ranking of how each university has done relative to the others in our sample. For each of these metrics we provide indexed values, which account for variation in women’s representation across STEM fields. For example, women have stronger representation in the life sciences but weaker representation in computer science on average, so we take this into consideration when we look at levels of female engagement in PhD fields or in patenting.
The impacts of universities as innovation nodes are amplified when patenting activity is focused in fields that are closely related to the industrial strengths of a region.
Lastly, we consider whether the university’s patent activity aligns with the economic activity in its region—meaning that the sorts of patenting fields (e.g., mechanical versus electrical or biological) developed at the university are connected with those of the wider economic area where the university is situated.
Universities in the top 10 economic areas for patenting (such as San Jose, New York, Boston, and Los Angeles) are separated in the scorecard from the other 28 regions to highlight the striking difference between the two groups. In economic areas with less patenting activity (like Tallahassee, Columbia, and Nashville), relatively more patenting activity is happening at universities. Outside the top economic areas, universities are responsible for 10% of their regions’ patents on average, compared to only 1.3% in top economic areas. Similar patterns can be observed for new inventor activity as well, signaling the importance of universities as sources of innovation in less economically productive regions.
The scorecard can be also used as a tool for understanding the inclusion of women in innovation at the macro and micro levels. Two macro-level trends are particularly important. First, universities in low patenting regions are acting as important hubs for female inclusion in innovation. Overall, more women are becoming inventors in top patenting regions (18.2%, versus 17.2% in areas outside the top 10). However, 8 of the 10 highest ranked university campuses in the scorecard are located outside the top regions. The share of women among new inventors at these universities is growing more rapidly on average. These improvements can be driven by a range of campus-specific factors, and each case is distinctive.
Second, the fit between universities’ patenting activity and the technological activities of their regions influences the regional gender dynamics of innovation (Figure 3). When a university’s STEM pipeline is well-matched to the hiring needs of the region’s innovative companies, investments made by the university to increase relevant STEM PhDs, support new inventors, and especially to improve the participation of women in innovative STEM fields can, in turn, influence the inventiveness and demographics of the workforce throughout a region. On the other hand, universities active in training and patenting in fields poorly matched to their local innovation economies have a harder time influencing regional innovation growth—overall and with regards to broadening representation.
Figure 3. Changes in shares of female inventors at universities and within regions
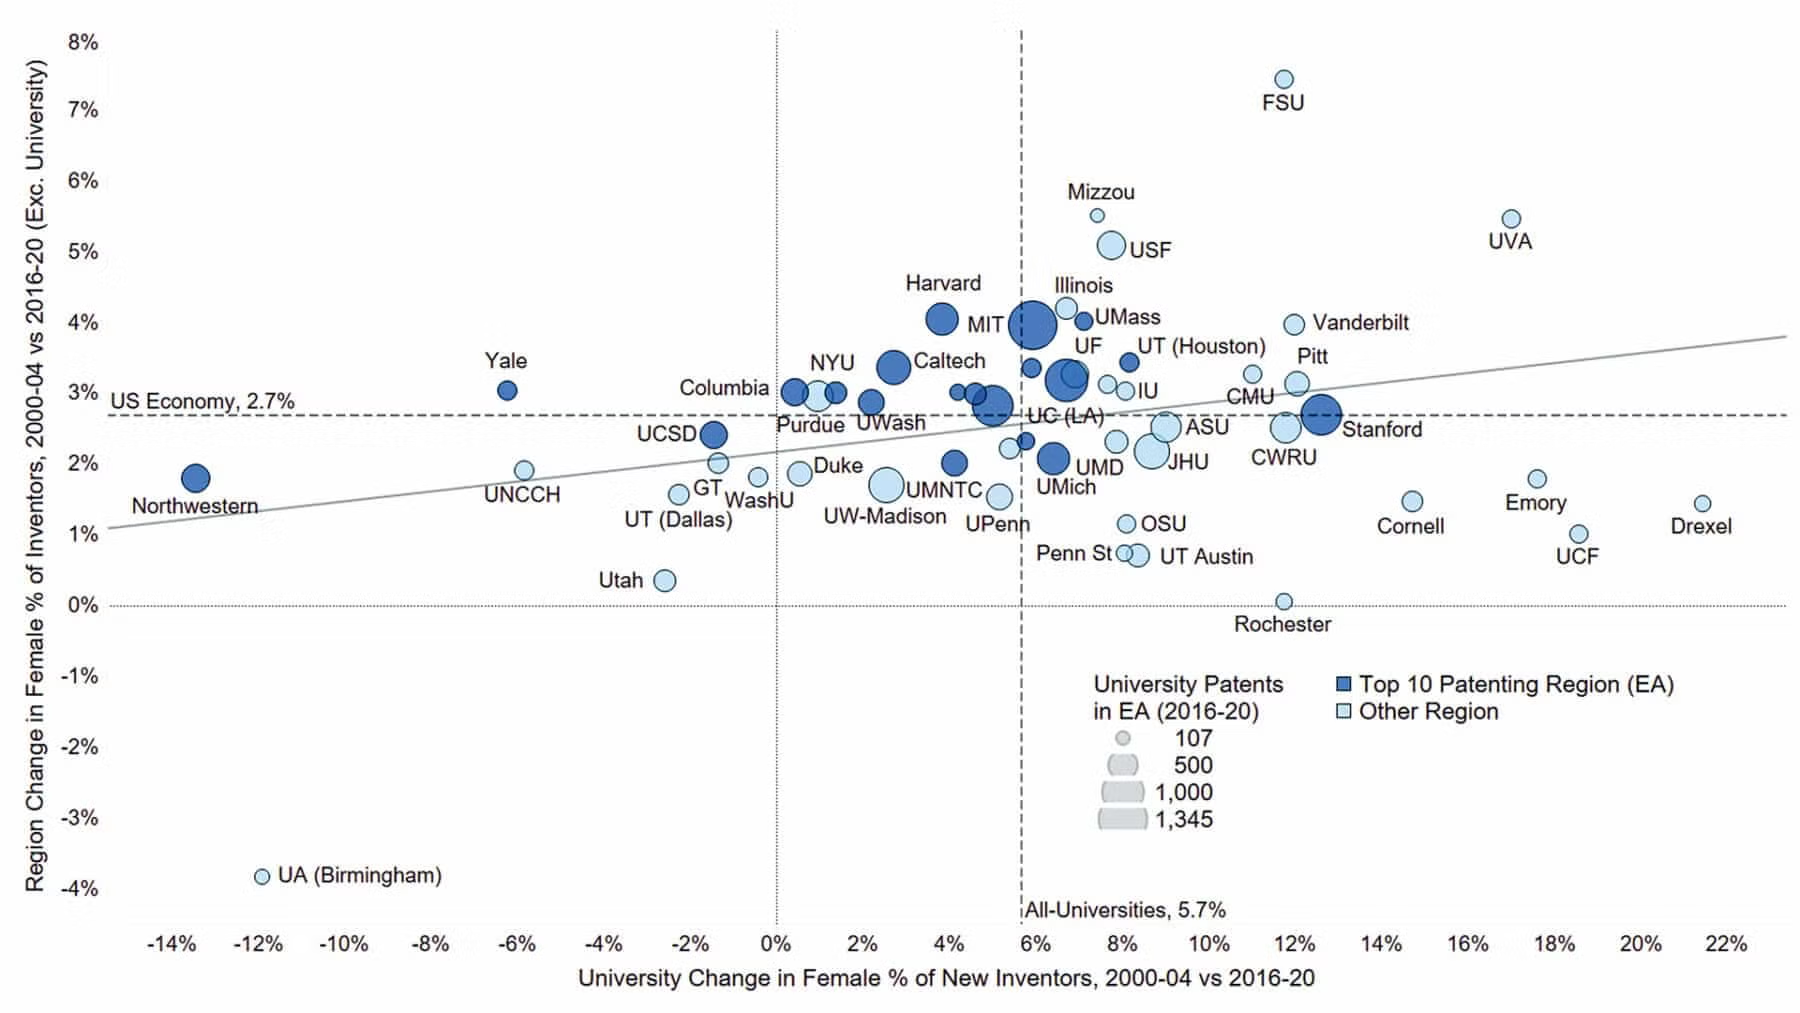
Comparing “University Change in Female % of New Inventors” (2000–2004 vs. 2016–2020) (V5 in the scorecard) with its “EA Region Change in Female % of All Inventors” (excluding the focal university patents). The vertical dashed line shows the change for all universities combined (5.7 percentage points), and the horizonal one the change in the US economy (2.7 percentage points) as a benchmark. Overall, improvements in inclusion in universities are positively related to regional improvements, but there are distinct cases. University-region pairs experiencing high changes include universities located in non-top patenting regions (e.g., the University of Virginia, the University of South Florida, Vanderbilt University). In contrast, university-region pairs with high changes in the university but low changes in the region show missed opportunities. This may be associated with a low technological match between the university and its region (e.g., Emory University with Atlanta, Georgia; and the University of Michigan with Detroit, Michigan).
At the micro level, universities’ scores speak to the ways campuses are approaching inclusive innovation and connecting to their regional innovation economies. For example, the University of Virginia is ranked 2nd overall in the scorecard, though Richmond ranks 48th in patenting activity. The university has the best score for the percentage of female new inventors, which grew by 17 percentage points over the last 20 years. The growth has taken place across multiple technology fields and is consistent with the school’s high female share of STEM PhDs—likely a reflection of ongoing, university-wide efforts to promote and support entrepreneurial activity among students and faculty.
The scorecard can be also used as a tool for understanding the inclusion of women in innovation at the macro and micro levels.
Similarly, the University of South Florida, Tampa (USF) is ranked 5th overall in the scorecard, though it is located in a region that is ranked 44th in patenting activity. Its female share of STEM PhDs and new inventors are both ranked in the top 10, after indexing for technology fields. The university and its region have both achieved significant improvements in inclusion (Figure 3). In 2019, USF was part of a coalition of Florida universities awarded $2.4 million from the National Science Foundation to improve opportunities for minority women in STEM on their campuses, with the larger goal of broadening the participation of women of color in STEM fields across the state. This kind of effort to expand the talent base in a region generally low in its contribution to STEM PhDs could yield significant dividends for the regional economy—though in this case the work may be disrupted by state legislation banning universities from using state or federal funds to support initiatives to improve diversity, equity, and inclusion.
And finally, the University of Michigan system (the three campuses in the Detroit economic area), ranked 37th in the scorecard but located in a top performing patenting region, is an example of a university that has improved its rate of inclusion for female new inventors (marginally, by six percentage points over 20 years). However, the school is training STEM PhDs and producing patents in fields with a poor technological fit for its regional economy. The university has significant strengths in the life sciences, but the region is more focused on automotive, aerospace, manufacturing materials, and automation technologies. Some of the most successful recent spinouts build on patents in 3D printing and motion capture for workplace safety—closely aligned to the technology needs of the regional clusters—but a high concentration of patents are in the life sciences.
Notably, every university on the scorecard has room for improvement. The scorecard, as well as the stories from universities that underscore best practices, provide some guidance on where to look for maximum impact and where to encourage change. They also help develop a shared understanding of the characteristics of regional innovation engines and the special role universities play in driving inclusive growth.