U.S. Economic Growth in the Information Age
We’re beginning to understand what fueled growth in the late 1990s, but there is much remaining to be explored.
The resurgence of the U.S. economy from 1995 to 1999 outran all but the most optimistic expectations. It is not surprising that the unusual combination of more rapid growth and slower inflation touched off a strenuous debate among economists about whether improvements in U.S. economic performance can be sustained. This debate has been intensified by the recent growth slowdown, and the focus has shifted to how best to maintain economic momentum.
A consensus is building that the remarkable decline in information technology (IT) prices provides the key to the surge in U.S. economic growth. The IT price decline is rooted in developments in semiconductor technology that are widely understood by technologists and economists. This technology has found its broadest applications in computing and communications equipment, but has reduced the cost and improved the performance of aircraft, automobiles, scientific instruments, and a host of other products.
Although prices have declined and product performance has improved in many sectors of the U.S. economy, our picture of these developments is still incomplete. The problem faced by economists is that prices are difficult to track when performance is advancing so rapidly. This year’s computer, cell phone, and design software is different from last year’s. Fortunately, statistical agencies are now focusing intensive efforts on filling in the gaps in our information.
Price indexes for IT that hold performance constant are necessary to separate the change in performance of IT equipment from the change in price for a given level of performance. Accurate and timely computer prices have been part of the U.S. National Income and Product Accounts (NIPA) since 1985. Software investment was added to the NIPA in 1999. Unfortunately, important information gaps remain, especially regarding price trends for investments in software and communications equipment.
Knowing how much the nation spends on IT is only the first step. We must also consider the dynamics of investment in IT and its impact on our national output. The national accounting framework treats IT equipment as part of the output of investment goods, and capital services from this equipment as a component of capital input. A measure of capital services is essential for capturing the effects of rapidly growing stocks of computers, communications equipment, and software on the output of the U.S. economy.
A substantial acceleration in the IT price decline occurred in 1995, triggered by a much sharper acceleration in the price decline of semiconductors. This can be traced to a shift in the product cycle for semiconductors in 1995 from three years to two years as the consequence of intensifying competition. Although the fall in semiconductor prices has been projected to continue for at least another decade, the recent acceleration may be temporary.
The investment boom of the later 1990s was not sustainable, because it depended on growth in hours worked that was substantially in excess of growth in the labor force. Nonetheless, growth prospects for the U.S. economy have improved considerably, due to enhanced productivity growth in IT production and rapid substitution of IT assets for non-IT assets in response to falling IT prices. An understanding of the role of IT is crucial to the design of policies to revive economic growth and exploit the opportunities created by our improved economic performance.
Faster, better, cheaper
A mantra of the “new economy”–“faster, better, cheaper”–captures the speed of technological change and product improvement in semiconductors and the precipitous and continuing fall in semiconductor prices. Modern IT begins with the invention of the transistor, a semiconductor device that acts as an electrical switch and encodes information in binary form. The first transistor, made of the semiconductor germanium, was constructed at Bell Labs in 1947.
The next major milestone in IT was the co-invention of the integrated circuit by Jack Kilby of Texas Instruments in 1958 and Robert Noyce of Fairchild Semiconductor in 1959. An integrated circuit consists of many, even millions, of transistors that store and manipulate data in binary form. Integrated circuits were originally developed for data storage, and these semiconductor devices became known as memory chips.
In 1965, Gordon E. Moore, then research director at Fairchild Semiconductor, made a prescient observation, later known as Moore’s Law. Plotting data on memory chips, he observed that each new chip contained roughly twice as many transistors as the previous chip and was released within 18 to 24 months of its predecessor. This implied exponential growth of chip capacity at 35 to 45 percent per year.
In 1968, Moore and Noyce founded Intel Corporation to speed the commercialization of memory chips, and Moore became a key participant in the realization of Moore’s Law. Integrated circuits gave rise to microprocessors, or logic chips, with functions that can be programmed. Intel’s first general-purpose microprocessor was developed for a calculator produced by Busicom, a Japanese firm. Intel retained the intellectual property rights and released the device commercially in 1971.
The rapidly rising capacities of microprocessors and storage devices illustrate the exponential growth predicted by Moore’s Law. The first logic chip in 1971 had 2,300 transistors; the Pentium 4, released by Intel on November 20, 2000, had 42 million. Over this 29-year period, the number of transistors increased by 34 percent per year, tracking Moore’s Law with astonishing accuracy.
Semiconductor prices. Moore’s Law captures the fact that successive generations of semiconductors are faster and better. The economics of semiconductors begins with the closely related observation that memory and logic chips have become cheaper at a truly staggering rate. Figure 1 gives semiconductor price indexes used in the U.S. national accounts since 1996. These are divided between memory chips and logic chips.
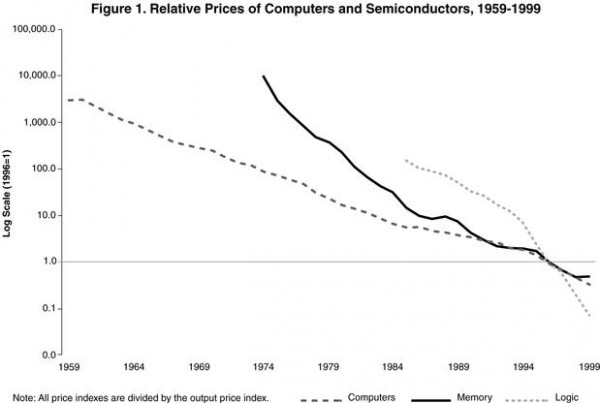
Prices of memory chips, holding performance constant, decreased by a factor of 27,270 times, or 40.9 percent per year, between 1974 and 1996. Similarly, prices of logic chips, again holding performance constant, available for the shorter period from 1985 to 1996, decreased by a factor of 1,938, or 54.1 percent per year. Whereas semiconductor price declines parallel Moore’s Law on the growth of chip capacity, the rate of price change has considerably exceeded the increase in capacity.
Figure 1 also reveals a sharp acceleration in the decline of semiconductor prices in 1994 and 1995. The microprocessor price decline leapt to more than 90 percent per year as the semiconductor industry shifted from a three-year product cycle to a two-year cycle.
Computer prices. The introduction of the personal computer (PC) by IBM in 1981 was a watershed event in the deployment of IT. The sale of Intel’s 8086-8088 microprocessor to IBM in 1978 for incorporation into the PC was a major business breakthrough for Intel. In 1981, IBM licensed the MS-DOS operating system from Microsoft.
Mainframe computers, as well as PCs, have come to rely heavily on logic chips for central processing and on memory chips for main memory. However, semiconductors account for less than half of computer costs, and computer prices have fallen much less rapidly than semiconductor prices.
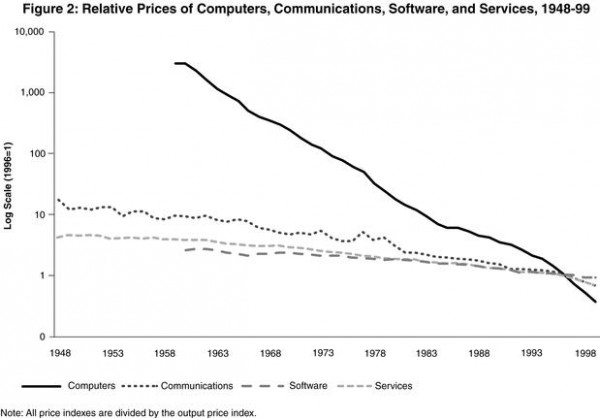
Figure 2 gives a constant performance price index of computers and peripheral equipment and their components, including mainframes, PCs, storage devices, other peripheral equipment, and terminals. The decline in computer prices follows the behavior of semiconductor prices presented in Figure 1, but in much attenuated form. The 1995 acceleration in the computer price decline mirrors the acceleration in the semiconductor price decline.
Communications equipment and software prices. Communications technology is crucial for the rapid development and diffusion of the Internet, perhaps the most striking manifestation of IT in the U.S. economy. Communications equipment is an important market for semiconductors, but constant performance price indexes have been developed only for switching and terminal equipment. Much communications investment takes the form of the transmission gear, which connects data, voice, and video terminals to switching equipment.
Technologies for transmission, such as fiber optics, microwave broadcasting, and communications satellites, have progressed at rates that outrun even the dramatic pace of semiconductor development. An example is dense wavelength division multiplexing (DWDM), a technology that sends multiple signals over an optical fiber simultaneously. Installation of DWDM equipment, beginning in 1997, has doubled the transmission capacity of fiber optic cables every 6 to 12 months.
Both software and hardware are essential for IT, and this is reflected in the large volume of software expenditures. The 11th comprehensive revision of the U.S. NIP A, released on October 27, 1999, reclassified computer software as investment. Before this important advance, business expenditures on software were simply omitted from the national product, leaving out a critical component of IT investment.
Software investment is growing rapidly and is now much more important than investment in computer hardware. The revised national accounts now distinguish among three types of software: prepackaged, custom, and own-account software. Unfortunately, only price indexes for prepackaged software hold performance constant.
An important challenge for economic measurement is to develop price indexes that hold performance constant for all of telecommunications equipment and software. This has been described as the “trench warfare” of economic statistics, because new data sources must be developed and exploited for each type of equipment and software. Until comprehensive price indexes are available, our picture of the role of IT in U.S. economic growth will remain incomplete.
The growth resurgence
The U.S. economy has undergone a remarkable resurgence since the mid-1990s, with accelerating growth in output and productivity. Although the decline in semiconductor prices is the driving force, the impact of this price decline is transmitted through the prices of computers, communications equipment, and software. These products appear in the NIPA as investments by businesses, governments, and households along with net exports to the rest of the world.
The output data in Table 1 are based on the most recent benchmark revision of the national accounts, updated through 1999. The output concept is similar, but not identical, to the concept of gross domestic product (GDP) used in the U.S. national accounts. Both measures include final outputs purchased by businesses, governments, households, and the rest of the world. The output measure in Table 1 also includes the services of durable goods, including IT products, used in the household and government sectors.
Table 1.
Growth Rates of Outputs and Inputs
| 1990-95 | 1995-99 | |||||
|---|---|---|---|---|---|---|
| Prices | Quantities | Prices | Quantities | |||
| OUTPUTS | ||||||
| Gross Domestic Product | 1.99 | 2.36 | 1.62 | 4.08 | ||
| Information Technology | -4.42 | 12.15 | -9.74 | 20.75 | ||
| Computers | -15.77 | 21.71 | -32.09 | 38.87 | ||
| Software | -1.62 | 11.86 | -2.43 | 20.80 | ||
| Communications Equipment | -1.77 | 7.01 | -2.90 | 11.42 | ||
| Information Technology Services | -2.95 | 12.19 | -11.76 | 18.24 | ||
| Non-Information Technology Investment | 2.15 | 1.22 | 2.20 | 4.21 | ||
| Non-Information Technology Consumption | 2.35 | 2.06 | 2.31 | 2.79 | ||
| INPUTS | ||||||
| Gross Domestic Income | 2.23 | 2.13 | 2.36 | 3.33 | ||
| Information Technology Capital Services | -2.70 | 11.51 | -10.46 | 19.41 | ||
| Computer Capital Services | -11.71 | 20.27 | -24.81 | 36.36 | ||
| Software Capital Services | -1.83 | 12.67 | -2.04 | 16.30 | ||
| Communications Equipment Capital Services | 2.18 | 5.45 | -5.90 | 8.07 | ||
| Non-Information Technology Capital Services | 1.53 | 1.72 | 2.48 | 2.94 | ||
| Labor Services | 3.02 | 1.70 | 3.39 | 2.18 | ||
Note: Average annual percentage rates of growth
The top panel of Table 1 summarizes the growth rates of prices and quantities for major output categories for 1990-1995 and 1995-1999. The most striking feature is the rapid price decline for computer investment: 15.8 percent per year from 1990 to 1995. Since 1995, this decline more than doubled to 32.1 percent per year. By contrast, the relative price of software fell only 1.6 percent per year from 1990 to 1995 and 2.4 percent per year since 1995. The price of communications equipment behaves similarly to the software price, whereas the price of IT services falls between hardware and software prices.
The second panel of Table 1 summarizes the growth rates of prices and quantities of capital inputs for 1990-1995 and 1995-1999. In response to the price changes, firms, households, and governments have accumulated computers, software, and communications equipment much more rapidly than other forms of capital. Growth of IT capital services jumped from 11.51 percent per year in 1990-1995 to 19.41 percent in 1995-1999, while growth of non-IT capital services increased from 1.72 percent to 2.94 percent.
Table 1 describes the rapid increase in the importance of IT capital services, reflecting the impact of growing stocks of computers, communications equipment, and software on the output of the U.S. economy. In 1995-1999, the capital service price for computers fell 24.8 percent per year, compared to an increase of 36.4 percent in capital input from computers. As a consequence, the value of computer services grew substantially. However, the current dollar value of computers was only 1.6 percent of gross domestic income in 1999.
The rapid accumulation of software appears to have different sources. The price of software services declined only 2.0 percent per year for 1995-1999. Nonetheless, firms have been accumulating software very rapidly, with real capital services growing 16.3 percent per year. A possible explanation is that firms respond to computer price declines by investing in complementary inputs such as software. However, a more plausible hypothesis is that the price indexes for software investment fail to hold performance constant, leading to an overstatement of inflation and an understatement of growth. This can be overcome only by extending constant performance price indexes to cover all software.
Although the price decline for communications equipment during the period 1995-1999 is comparable to that of software, investment in this equipment is more in line with prices. However, constant performance price indexes are unavailable for transmission gear, such as fiber optic cables. This leads to an underestimate of the growth rates of investment, capital services, and the GDP, as well as an overestimate of the rate of inflation. High priority should be assigned to the development of constant performance price indexes for all communications equipment.
Accounting for growth. Growth accounting identifies the contributions of outputs as well as inputs to U.S. economic growth. The growth rate of the GDP is a weighted average of growth rates of the outputs of investment and consumption goods. The contribution of each output is its growth rate, weighted by its share in the value of the GDP. Similarly, the growth rate of input is a weighted average of growth rates of capital and labor services, and the contribution of each input is its weighted growth rate. Total factor productivity (TFP) is defined as output per unit of input.
The results of growth accounting can also be presented in terms of average labor productivity (ALP), defined as the ratio of output to hours worked. The growth in ALP can be allocated among three sources. The first is capital deepening: the growth in capital input per hour worked, reflecting capital-labor substitution. The second is improvement in labor quality and captures the rising proportion of hours by workers with higher productivity. The third component adds a percentage point to ALP growth for each percentage point of TFP growth.
Massive increases in computing power, such as those experienced by the U.S. economy, have two effects on growth. First, as IT producers become more efficient, more IT equipment and software are produced from the same inputs. This raises productivity in IT-producing industries and contributes to TFP growth for the economy as a whole. Labor productivity also grows at both industry and aggregate levels.
Second, investment in IT leads to growth of productive capacity in IT-using industries. Because labor is working with more and better equipment, this increases ALP through capital deepening. If the contributions to aggregate output are entirely captured by capital deepening, aggregate TFP growth is unaffected, because output per unit of input remains unchanged.
To understand the distinctive features of economic growth since 1995, we need a picture of the growth of the U.S. economy for the past half century. Table 2 presents results of a growth accounting decomposition for the period 1948-1999 and various subperiods. Economic growth is broken down by output and input categories, quantifying the contribution of IT to investment and consumption outputs, as well as capital inputs. These estimates are based on computers, software, and communications equipment as distinct types of IT.
Table 2.
Sources of Gross Domestic Product Growth
| 1948-99 | 1948-73 | 1973-90 | 1990-95 | 1995-99 | |||
|---|---|---|---|---|---|---|---|
| OUTPUTS | |||||||
| Gross Domestic Product | 3.46 | 3.99 | 2.86 | 2.36 | 4.08 | ||
| Contribution of Information Technology | 0.40 | 0.20 | 0.46 | 0.57 | 1.18 | ||
| Computers | 0.12 | 0.04 | 0.16 | 0.18 | 0.36 | ||
| Software | 0.08 | 0.02 | 0.09 | 0.15 | 0.39 | ||
| Communications Equipment | 0.10 | 0.08 | 0.10 | 0.10 | 0.17 | ||
| Information Technology Services | 0.10 | 0.06 | 0.10 | 0.15 | 0.25 | ||
| Contribution of Non-Information Technology | 3.06 | 3.79 | 2.40 | 1.79 | 2.91 | ||
| Contribution of Non-Information Technology Investment | 0.72 | 1.06 | 0.34 | 0.23 | 0.83 | ||
| Contribution of Non-Information Technology Consumption | 2.34 | 2.73 | 2.06 | 1.56 | 2.08 | ||
| INPUTS | |||||||
| Gross Domestic Income | 2.84 | 3.07 | 2.61 | 2.13 | 3.33 | ||
| Contribution of Information Technology Capital Services | 0.34 | 0.16 | 0.40 | 0.48 | 0.99 | ||
| Computers | 0.15 | 0.04 | 0.20 | 0.22 | 0.55 | ||
| Software | 0.07 | 0.02 | 0.08 | 0.16 | 0.29 | ||
| Communications Equipment | 0.11 | 0.10 | 0.12 | 0.10 | 0.14 | ||
| Contribution of Non-Information Technology Capital Services | 1.36 | 1.77 | 1.05 | 0.61 | 1.07 | ||
| Contribution of Labor Services | 1.14 | 1.13 | 1.16 | 1.03 | 1.27 | ||
| Total Factor Productivity | 0.61 | 0.92 | 0.25 | 0.24 | 0.75 | ||
Note: Average annual percentage rates of growth. The contribution of an output or input is the rate of growth, multiplied by the value share.
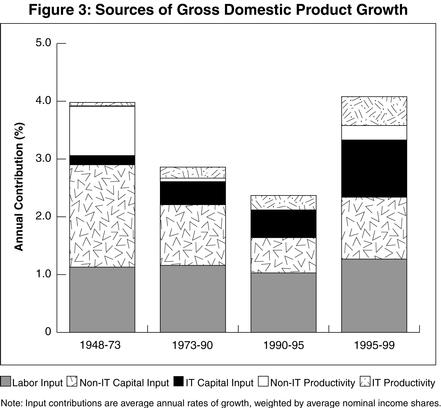
Capital input contributes 1.70 percentage points to GDP growth for the entire period from 1948 to 1999, labor input 1.14 percentage points, and TFP growth only 0.61 percentage points. Input growth is the source of nearly 82.3 percent of U.S. GDP growth of 3.46 percent per year over the past half century, whereas growth of output per unit of input or TFP has accounted for only 17.7 percent. Figure 3 depicts the relatively modest contributions of TFP in all subperiods.
A look at the U.S. economy before and after 1973 reveals familiar features of the historical record. After strong output and TFP growth in the 1950s, 1960s, and early 1970s, the U.S. economy slowed markedly during 1973-1990, with output growth falling from 3.99 percent for 1948-1973 to 2.86 percent for 1973-1990 and TFP growth declining from 0.92 percent to 0.25 percent. Growth in capital inputs also slowed from 4.64 percent to 3.57 percent.
Although the contribution of IT has increased steadily throughout the period 1948-1999, there was a sharp and easily recognizable response to the acceleration in the IT price decline in 1995. Relative to the early 1990s, output growth increased by 1.72 percent in 1995-1999. The contribution of IT production almost doubled but still accounted for only 28.9 percent of the increased growth of output. More than 70 percent of the increased output growth can be attributed to non-IT products.
Capital investment has been the most important source of U.S. economic growth throughout the postwar period. The relentless decline in the prices of IT equipment has steadily enhanced the role of IT investment. The rising importance this investment has given additional weight to highly productive components of capital.
Between 1990-1995 and 1995-1999, the contribution of capital input jumped by 0.95 percentage points, the contribution of labor input rose by 0.24 percent, and TFP accelerated by 0.51 percent. The contribution of capital input reflects the investment boom of the late 1990s. Businesses, households, and governments poured resources into plant and equipment, especially computers, software, and communications equipment. The jump in the contribution of capital input since 1995 has boosted growth by nearly a full percentage point, and IT accounts for more than half of this increase.
After maintaining an average rate of 0.25 percent for the period 1973-1990, TFP growth continued at 0.24 percent for 1990-1995 and then vaulted to 0.75 percent per year for 1995-1999. This increase in output per unit of input is an important source of growth in output of the U.S. economy, as depicted in Figure 3. Although TFP growth for 1995-1999 is lower than the rate of 1948-1973, the U.S. economy is definitely recuperating from the anemic productivity growth of the previous two decades.
The accelerating decline of IT prices signals faster productivity growth in IT-producing industries. In fact, these industries have been the source of most productivity growth throughout the 1990s. Before 1995, this was due to the decline of productivity growth elsewhere in the economy. The IT-producing industries have accounted for about half of the surge in productivity growth since 1995, far greater than IT’s 4.26 percent share of GDP. Faster growth is not limited to these industries, and there is evidence of a productivity revival in the rest of the economy.
Average labor productivity. Output growth is the sum of growth in hours and average labor productivity. Figure 3 reveals the well-known productivity slowdown of the 1970s and 1980s and depicts the acceleration in labor productivity growth in the late 1990s. The slowdown through 1990 reflects reduced capital deepening, declining labor quality growth, and decelerating growth in TFP. This contributed to the sluggish ALP growth revealed in Table 3: 2.82 percent for 1948-1973 and 1.26 percent for 1973-1990.
Table 3.
Sources of Average Labor Productivity Growth
(Average annual percentage rates of growth)
| 1948-99 | 1948-73 | 1973-90 | 1990-95 | 1995-99 | ||||
|---|---|---|---|---|---|---|---|---|
| OUTPUTS | ||||||||
| Gross Domestic Product | 3.46 | 3.99 | 2.86 | 2.36 | 4.08 | |||
| Hours Worked | 1.37 | 1.16 | 1.59 | 1.17 | 1.98 | |||
| Average Labor Productivity | 2.09 | 2.82 | 1.26 | 1.19 | 2.11 | |||
| Contribution of Capital Deepening | 1.13 | 1.45 | 0.79 | 0.64 | 1.24 | |||
| Information Technology | 0.30 | 0.15 | 0.35 | 0.43 | 0.89 | |||
| Non-Information Technology | 0.83 | 1.30 | 0.44 | 0.21 | 0.35 | |||
| Contribution of Labor Quality | 0.34 | 0.46 | 0.22 | 0.32 | 0.12 | |||
| Total Factor Productivity | 0.61 | 0.92 | 0.25 | 0.24 | 0.75 | |||
| Information Technology | 0.16 | 0.06 | 0.19 | 0.25 | 0.50 | |||
| Non-Information Technology | 0.45 | 0.86 | 0.06 | -0.01 | 0.25 | |||
| ADDENDUM | ||||||||
| Labor Input | 1.95 | 1.95 | 1.97 | 1.70 | 2.18 | |||
| Labor Quality | 0.58 | 0.79 | 0.38 | 0.53 | 0.20 | |||
| Capital Input | 4.12 | 4.64 | 3.57 | 2.75 | 4.96 | |||
| Capital Stock | 3.37 | 4.21 | 2.74 | 1.82 | 2.73 | |||
| Capital Quality | 0.75 | 0.43 | 0.83 | 0.93 | 2.23 | |||
The growth of ALP slipped further during the early 1990s, with a slump in capital deepening only partly offset by a revival in labor quality growth and an uptick in TFP growth. A slowdown in hours combined with slowing ALP growth during 1990-1995 to produce a further slide in the growth of output. In previous cyclical recoveries during the postwar period, output growth accelerated during the recovery, powered by more rapid growth of hours and ALP.
Accelerating output growth during 1995-1999 reflects growth in labor hours and ALP almost equally. Growth in ALP rose 0.92 as more rapid capital deepening and growth in TFP offset slower improvement in labor quality. Growth in hours worked accelerated as unemployment fell to a 30-year low. Labor markets have tightened considerably, even as labor force participation rates increased.
Comparing 1990-1995 to 1995-1999, the rate of output growth jumped by 1.72 percent due to an increase in hours worked of 0.81 percent and another increase in ALP growth of 0.92 percent. Table 3 shows that the acceleration in ALP growth is due to capital deepening as well as to faster TFP growth. Capital deepening contributed 0.60 percentage points, offsetting a negative contribution of labor quality of 0.20 percent. The acceleration in TFP added 0.51 percentage points.
The difference between growth in capital input and capital stock is the improvement in capital quality. This represents the substitution toward assets with higher productivity. The growth of capital quality is slightly less than 20 percent of capital input growth for the period 1948-1995. However, improvements in capital jumped to 44.9 percent of total growth in capital input during the period 1995-1999, reflecting very rapid restructuring of capital to take advantage of the sharp acceleration in the IT price decline.
The distinction between labor input and labor hours is analogous to the distinction between capital services and capital stock. The growth in labor quality is the difference between the growth in labor input and hours worked. Labor quality reflects the increased relative importance of workers with higher productivity. Table 3 presents estimates of labor input, hours worked, and labor quality.
As shown in Table 1, the growth rate of labor input accelerated to 2.18 percent for 1995-1999 from 1.70 percent for 1990-1995. This is primarily due to the growth of hours worked, which rose from 1.17 percent for 1990-1995 to 1.98 percent for 1995-1999, as labor force participation increased and unemployment rates plummeted. The growth of labor quality declined considerably in the late 1990s, dropping from 0.53 percent for 1990-1995 to 0.20 percent for 1995-1999. With exceptionally low unemployment rates, employers were forced to add workers with limited skills and experience.
The acceleration in U.S. economic growth after 1995 is unmistakable, and its relationship to IT is now transparent. The most important contribution of IT is through faster growth of capital input, reflecting higher rates of investment. More rapid growth of output per unit of input also captures an important component of the contribution of IT. The issue that remains is whether these trends in economic growth are sustainable.
What happens next?
Falling IT prices will continue to provide incentives for the substitution of IT for other productive inputs. The decline in IT prices will also serve as an indicator of ongoing productivity growth in IT-producing industries. However, it would be premature to extrapolate the recent acceleration in productivity growth into the indefinite future, since this depends on the persistence of a two-year product cycle for semiconductors.
The economic forces that underlie the two-year product cycle for semiconductors reflect intensifying competition among semiconductor producers in the United States and around the world. Over the next decade, the persistence of this rapid rate of technological progress will require the exploitation of new technologies. This is already generating a massive R&D effort that will strain the financial capacities of the semiconductor industry and its equipment suppliers.
The International Technology Roadmap for Semiconductors projects a two-year product cycle through 2003 and a three-year product cycle thereafter. This seems to be a reasonable basis for projecting growth of the U.S. economy. Continuation of a two-year cycle provides an upper bound for growth projections, and reversion to a three-year cycle gives a lower bound. The range of projections is useful in suggesting the uncertainties associated with intermediate-term projections of U.S. economic growth.
The key assumption for intermediate-term projections of a decade or so is that output and capital stock grow at the same rate. This is characteristic of the United States and most industrialized economies over periods of time longer than a typical business cycle. Under this assumption, the growth of output is the sum of the growth rates of hours worked and labor quality and the contributions of capital quality growth and TFP growth. A projection of U.S. economic growth depends on the outlook for each of these components.
During the period 1995-1999, hours worked grew at an unsustainable rate of nearly 2 percent per year, almost double that of the labor force. Future growth of the labor force, which depends on population demographics and is highly predictable, will average only 1.2 percent per year for the next decade. This is the best assumption for the growth of hours worked as well. Growth of labor quality during 1995-1999 dropped to 0.2 percent per year and will revive, modestly, to 0.3 percent per year, reflecting ongoing improvements in the productivity of individual workers.
The overall growth rate of labor input will be 1.5 percent per year. This is the starting point for an intermediate-term projection of U.S. economic growth. It is worth noting that this will reduce economic growth by 0.7 percent per year, relative to the 1995-1999 average, showing that the growth rate of the late 1990s was simply unsustainable. The growth of hours worked during this period reflected nonrecurring declines in the rate of unemployment and one-time increases in rates of labor force participation.
The second part of a growth projection requires assumptions about the growth of TFP and capital quality. These assumptions are subject to considerable uncertainty. So long as the two-year product cycle for semiconductors continues, the growth of TFP is likely to average 0.75 percent per year, the rate during 1995-1999. With a three-year product cycle, the growth of TFP will drop to 0.50 percent per year, reflecting the slower rate of technological change in IT-producing industries.
The rapid substitution of IT assets for non-IT assets in response to declining IT prices is reflected in the contribution of capital quality.
The growth of capital quality will continue at the recent rate of 2.2 percent per year, as long as the two-year product cycle for semiconductors persists.
However, growth of capital quality will drop to 0.9 percent per year under the assumption of a three-year product cycle, generating considerable uncertainty about future growth.
Assuming continuation of a two-year product cycle for semiconductors through 2003 and a three-year product cycle after that, the intermediate-term growth rate of the U.S. economy will be 3.3 percent per year. The upper bound on this growth rate associated with continuation of a three-year product cycle is 4.2 percent per year, whereas the lower bound associated with a two-year product cycle is 2.9 percent per year. Obviously, this is a very wide range of possibilities, reflecting the substantial fluctuations in the growth rates of the U.S. economy over the past several decades.
Persistence of the growth resurgence of 4.2 percent per year for 1995-1999 requires extremely optimistic assumptions about the future of semiconductor technology. However, it is important to emphasize that U.S. growth prospects have improved considerably. The average growth rate from 1973-1990 was 2.9 percent per year, the lower bound of the estimates of future growth given above. Moreover, the growth rate from 1990-1995 was only 2.4 percent per year, well below the range of estimates consistent with more recent experience.
The performance of the IT industries has become crucial to future growth prospects. We must give close attention to the uncertainties that surround the future development and diffusion of IT. Highest priority must be given to a better understanding of markets for semiconductors and, especially, the determinants of the product cycle. Improved data on the prices of telecommunications and software are essential for understanding the links between semiconductor technology and the growth of the U.S. economy.
The semiconductor industry and the IT industries are global in their scope, with an elaborate international division of labor. This poses important questions about the U.S. growth resurgence. Where is the evidence of the impact of IT in other leading industrialized countries? Another unknown is the future role of important participants in IT–Korea, Malaysia, Singapore, and Taiwan–all “newly industrializing” economies. What will the economic impact of IT be in developing countries such as China and India?
IT is altering product markets and business organizations, as attested by the huge and rapidly growing business literature, but a fully satisfactory model of the semiconductor industry remains to be developed. Such a model would have to derive the demand for semiconductors from investment in IT and determine the product cycle for successive generations of new semiconductors.
As policymakers attempt to fill the widening gaps between the information required for sound policy and the available data, the traditional division of labor between statistical agencies and policymaking bodies is breaking down.
For example, the Federal Reserve Board has recently undertaken a major research program on constant performance IT price indexes. In the meantime, monetary policymakers must set policies without accurate measures of price change. Similarly, fiscal policymakers confront repeated revisions of growth projections that drastically affect the outlook for future tax revenues and government spending.
The unanticipated U.S. growth revival of the 1990s has considerable potential for altering economic perspectives. In fact, this is already foreshadowed in a steady stream of excellent books on the economics of IT. Economists are the fortunate beneficiaries of a new agenda for research that could refresh their thinking and revitalize their discipline. Their insights will be essential for reshaping economic policy to enable all U.S. companies to take advantage of the opportunities that lie ahead.