Don’t Rank Research Universities—Compare Them
Collectively, US research universities are the envy of the world. But they do make an unusual collection—a complex mix of public and private institutions pursuing different missions supported by a range of financial models. Flagship state universities have funded mandates to educate state residents at low tuition, while elite private universities can supplement tuition revenues with endowment support. Comparing institutions with such different operating conditions is a major challenge; developing strategies and policies to address the health of the whole enterprise is an even greater one.
Though the number and diversity of research institutions strengthen US innovation, research universities are facing an era of new hurdles that will test individual institutions’ abilities to adapt. After decades of increases, the number of high school graduates is projected to peak in 2025, which will force universities to compete over a shrinking pool of prospective students. Artificial intelligence will likely have significant—but still uncertain—impacts on the teaching, research, and operations of universities. And finally, the cost of university research is increasing. Universities are responsible for an increasing share of the total cost of research—an average of 25 cents for every dollar of external support—which puts extra financial pressure on institutions struggling to stay research-intensive. If federal support for research continues to fall as it has over the last decade, the situation for struggling universities will become even more urgent.
If the country is to continue leaning on research universities as the drivers of discovery, innovation, workforce development, and economic competitiveness, a national conversation about the future of these institutions is necessary. Unfortunately, the prevailing methods for comparing universities are insufficient for informing this discussion. Rankings that list universities like sports teams are arbitrarily weighted by the ranker, focused on branding the “best” for an arbitrary consumer and increasing traffic to the ranker’s website.
Rankings that list universities like sports teams are arbitrarily weighted by the ranker, focused on branding the “best” for an arbitrary consumer and increasing traffic to the ranker’s website.
To catalyze a more data-driven conversation, I developed an analytical framework for understanding the similarities and differences across top US research universities. Using principal component analysis, a technique that combines possibly correlated features (variables) in large datasets into components to visualize the drivers of variance, makes it possible to map universities by the relative influence of over a dozen characteristics shaping them.
My analysis is based on data from the 70 schools at the top of the 2024 US News & World Report (USNWR) Best National University rankings—a set of 32 state and 38 private institutions. All except two are considered R1 universities in the Carnegie classification (associated with “very high research spending and doctoral production”), so the feature set is biased toward research impact and the effectiveness of undergraduate education. My analysis captures information about each university’s financial models, student body, educational outcomes, research performance, and reputation. The following 18 features are included for each university: total university expenditures per undergraduate student; number of undergraduate students; number of graduate students; undergraduate acceptance rate; four-year undergraduate graduation rate; six-year undergraduate graduation rate; percentage of international undergraduate students; faculty-to-student ratio; number of doctoral degrees awarded; total university expenditures on research; percentage of publications in top scholarly journals; the university’s field-weighted citation impact; tuition and fees; average debt for graduates; percentage of graduates with debt; percentage of freshman class with Pell Grants; net cost of undergraduate tuition and fees after financial aid; and the university’s peer assessment score from the USNWR survey (assigned by a set of top academics assessing academic quality of the entire university on a five-point scale).
The results are displayed in a biplot (Figure 1) of the two components representing the most variance, statistically measuring the differences between universities. The first component (PCA1) represents 37% of the variance, and the second (PCA2) 25%; the remaining variance is scattered over the other 16 components. All features are represented in both components.
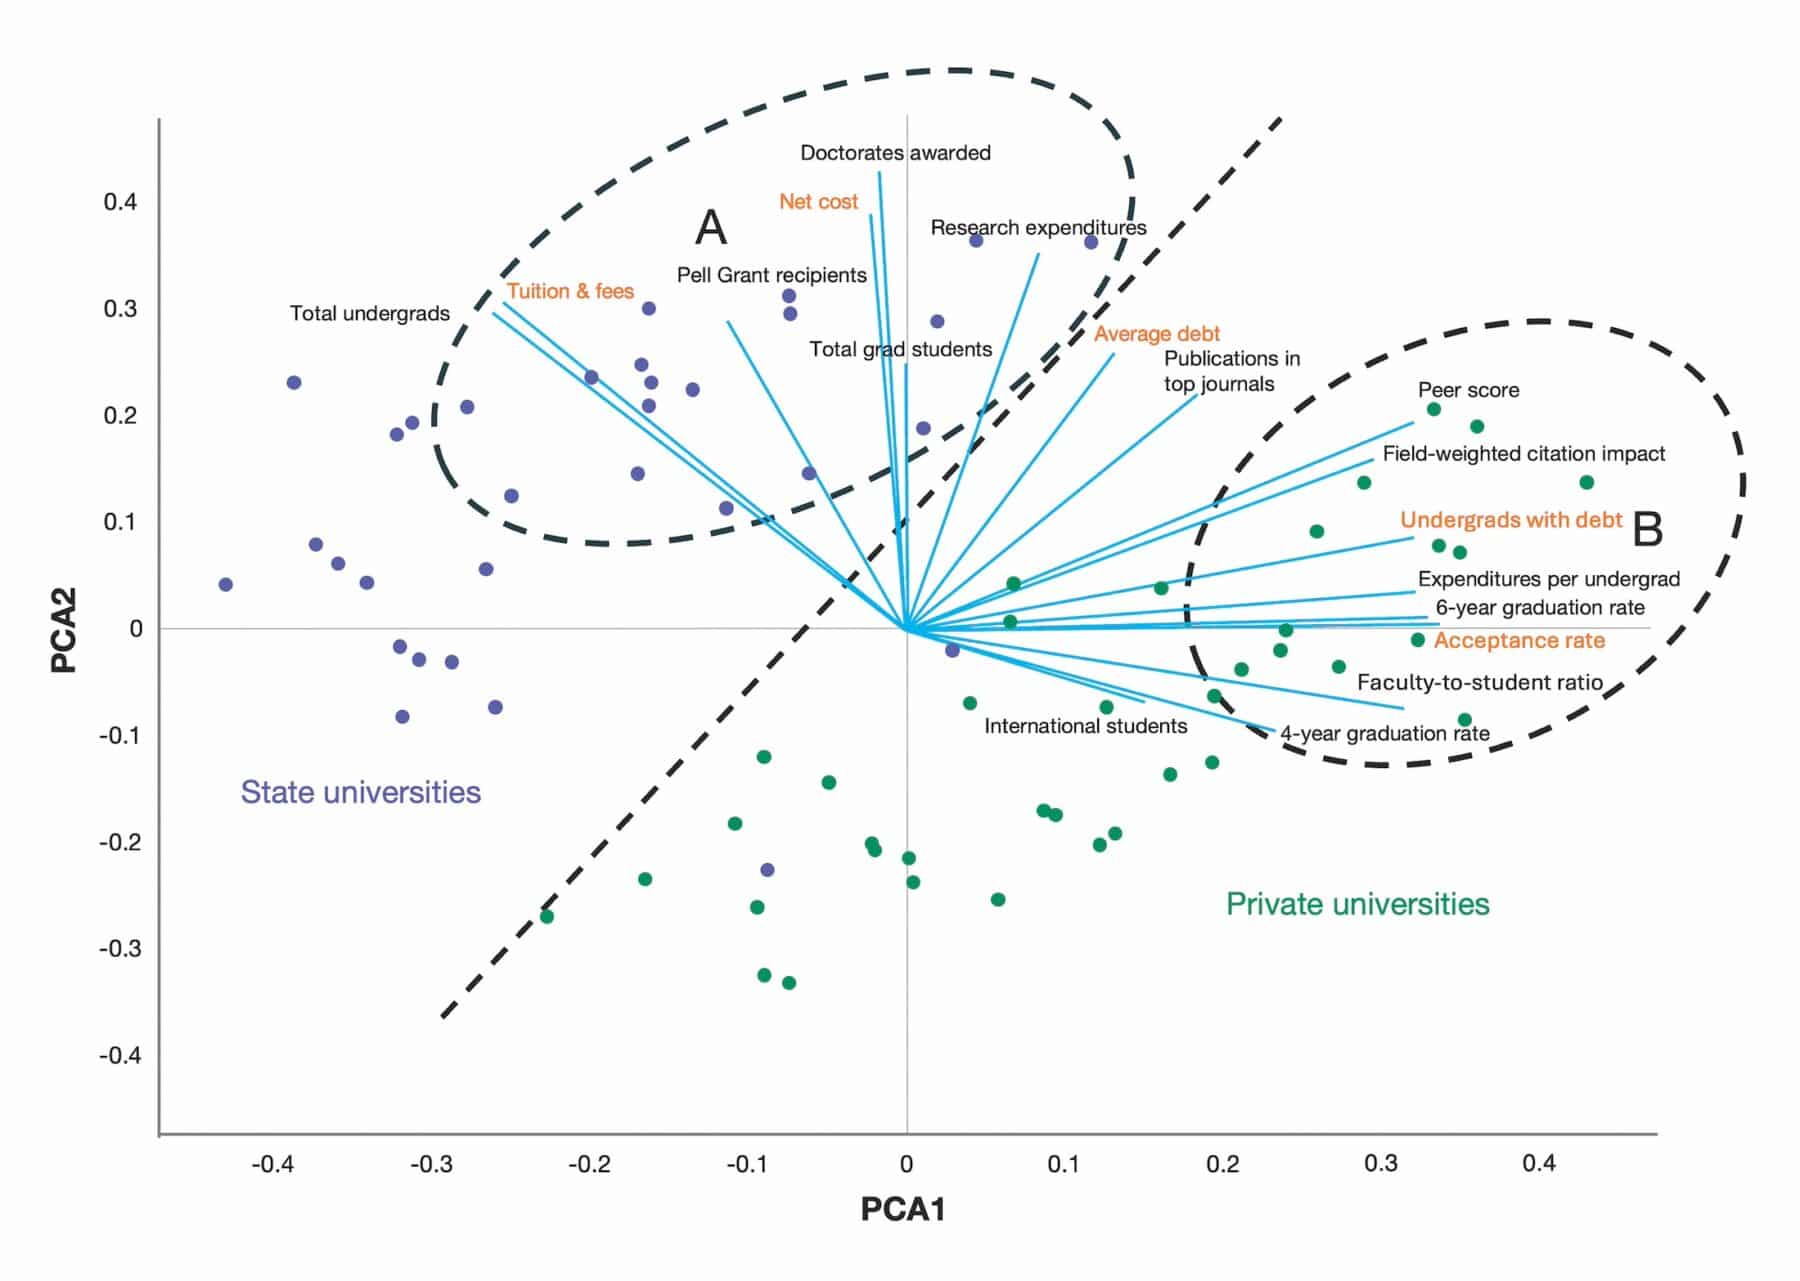
B = Elite private universities with high peer scores, low acceptance rates, and high graduation rates
Each principal component analysis (PCA) component has values for the 18 features; the blue lines stretch from the origin (0.0) to the end point representing the value of the feature in the two components, with the origin representing the median of each feature. The features are standardized, and all have been scaled, so that a larger positive value is considered optimal; features with an inverted scale are labeled in orange (e.g., a high value for “acceptance rate” feature corresponds to a low acceptance rate). The projection of individual universities onto the two components is shown by the dots with state universities in purple and private ones in green. (Each PCA component is normalized; it would be more meaningful to scale PCA2 with the ratio of the variances (25/37 = 0.68), but this squashes this component toward the horizontal axis and makes the plot more difficult to read.)
The biplot makes several important observations possible. In the first place, correlation and independence between variables are easier to detect. For example, the orthogonal positioning of the vectors associated with universities’ peer scores or citation impact (variables that reflect what others think of the university) from the vectors for Pell Grant recipients, number of graduate students, and low net cost indicates that these two sets of variables have little influence on each other. Conversely, there is a strong correlation among a university’s peer assessment score, its selectivity (low acceptance rate), and its low percentage of graduates with debt. What this tells us is that being highly selective and offering financial aid to keep student debt low are important to being considered elite. Notably, the wealthiest private universities have high tuition but can afford to meet students’ financial need. Another strong correlation is seen between citation impact and percentage of publications in top scholarly journals, but neither variable has a strong correlation with total research expenditure. A bigger research budget is not necessarily better.
A second set of insights comes from the distribution of private and public universities throughout the biplot. The most glaring result is the separation of public and private universities into two distinct clusters. One cluster is associated with positive values of features in the first component (PCA1), including peer score, citation impact, faculty-student ratio, expenditures per undergraduate student, and undergraduate graduation rate, corresponding to those associated with elite research universities. The features with the strongest negative correlation in the first component (that is, features that pull institutions to the left on the PCA1, or horizontal, axis) are low tuition and fees and large undergraduate numbers, which are also the features with the strongest positive correlation (pushing institutions up the vertical axis) for the second component (PCA2), along with the number of Pell Grant recipients. These features define the second cluster of universities. To state it simply: high values of PCA1 are associated with typical metrics for quality, and high values of PCA2 are associated with the scale of the university and a focus on undergraduate access. All universities to the left of the dashed line are state institutions, and all but two universities to the right of the line are private.
Diverging enrollment
It is easy to understand how variance in net cost and tuition distinguish public and private universities, but my analysis suggests the characteristics shaping student populations are also important. The other features connected with the cluster of public universities are undergraduate student enrollment, percentage of Pell Grant recipients, and, to a lesser extent, number of graduate students. Data from the National Center for Education Statistics’ Integrated Postsecondary Education Data System (IPEDS) for 2022 show private universities’ median undergraduate student enrollment had grown by 8% since 2012. Growth at state universities was much higher, at 13%, perhaps because flagship state schools needed to increase enrollment to boost tuition revenue.
A different story emerges for graduate student enrollment. Over the same decade, graduate student populations grew by 10% at state universities and by 16% at private ones. Undoubtedly, both increases reflect the influence of professional schools and the importance of master’s programs to generate tuition revenue. Though the median graduate student populations at private and public institutions were similarly sized in 2022 (7,900 for state schools and 7,100 for private schools), graduate students made up only 20% of the student body at public universities but 50% at private universities.
To catalyze a more data-driven conversation, I developed an analytical framework for understanding the similarities and differences across top US research universities.
In the principal component analysis, the number of doctoral students and the total graduate student populations are unimportant in PCA1, and both contribute positively to PCA2. This suggests that institutions can grow these programs by leveraging their reputations without negatively affecting it.
Interestingly, average faculty-to-student ratios reported to USNWR—1:16 for state and 1:9 for private universities—were unchanged from 2012 to 2022. Data from IPEDS on tenure-track faculty size did not mirror the growth in undergraduate enrollment. Tenure-track faculty numbers were up only 5.7% for state and 4.7% for private institutions, implying that both are relying on contingent faculty or graduate students to teach the additional undergraduates in order to balance the costs of adding research faculty, which include higher salaries, lower teaching loads, and laboratories and other infrastructure.
Public and private universities enroll recipients of federal Pell Grants—awards for students who demonstrate exceptional financial need—at similar rates. Pell students make up 16% of enrollment at private universities and 22% at state universities, albeit with a considerable range about the average. Though the enrollment outcomes are similar, state and private institutions use different approaches to enroll Pell Grant recipients. State universities maintain low tuition usually without substantial need-based aid; the better-endowed private universities give substantial financial aid; and less-endowed private institutions may ask students to take on debt. In my analysis, higher percentages of Pell students are connected to the cluster of state universities, indicating the important role of these institutions in providing access to undergraduate education. Pell recipients correlate positively with lower net cost and tuition, but negatively with peer scoreand graduation rate, suggesting that measures to keep tuition low can come at a cost to reputation.
For all the attention recruitment of international students has received in recent years, the percentage of international undergraduate students does not appear to be an influential component of the analysis. Most international undergraduates are not offered financial aid and are therefore very sensitive to price and perceptions of quality. Since the tuition these students pay can subsidize need-based aid for domestic students, universities compete for international talent—even as some observers contend that expanding the international student body narrows the acceptance rate for US students.
International talent recruitment is seen by many—myself included—as key to US global leadership in science and engineering; however, much of this talent enters the country through graduate research programs, where they compete for ample merit-based financial aid. Many come from the very best undergraduate institutions around the world, such as the Indian Institutes of Technology and Tsinghua University in Beijing. In my view, to make good on the resources invested in these students, their graduate diplomas should have green cards stapled to them.
The power of an endowment
Although my analysis has so far focused on the two groups of universities clearly separated in Figure 1, cluster analysis suggests there are actually three: private universities can be divided into two sets. One set has lower (and negative) values of PCA1 and PCA2 than the other: they are smaller and more expensive than public flagship universities but lack the prestige of the leading private universities.
Performing another principal component analysis on only the private institutions and with the addition of another feature—the endowment per student—allows a better look at the distinction between these two sets (Figure 2). Including endowments as an explicit variable further separates the best-endowed institutions from the pack, reinforcing the latent effects of endowments on other measures of academic quality. In 2021, the sum of endowments for the five universities with the largest endowments was greater than the combined value for the other 33 private universities in my dataset. From 2012 to 2022, endowments for the 38 private schools in the analysis grew at an average annual rate of 9.2%. Universities with large endowments can reasonably expect endowment contributions to continue growing above the inflation rate, lessening the pressure to expand enrollment in response to higher operating costs, from research or otherwise.
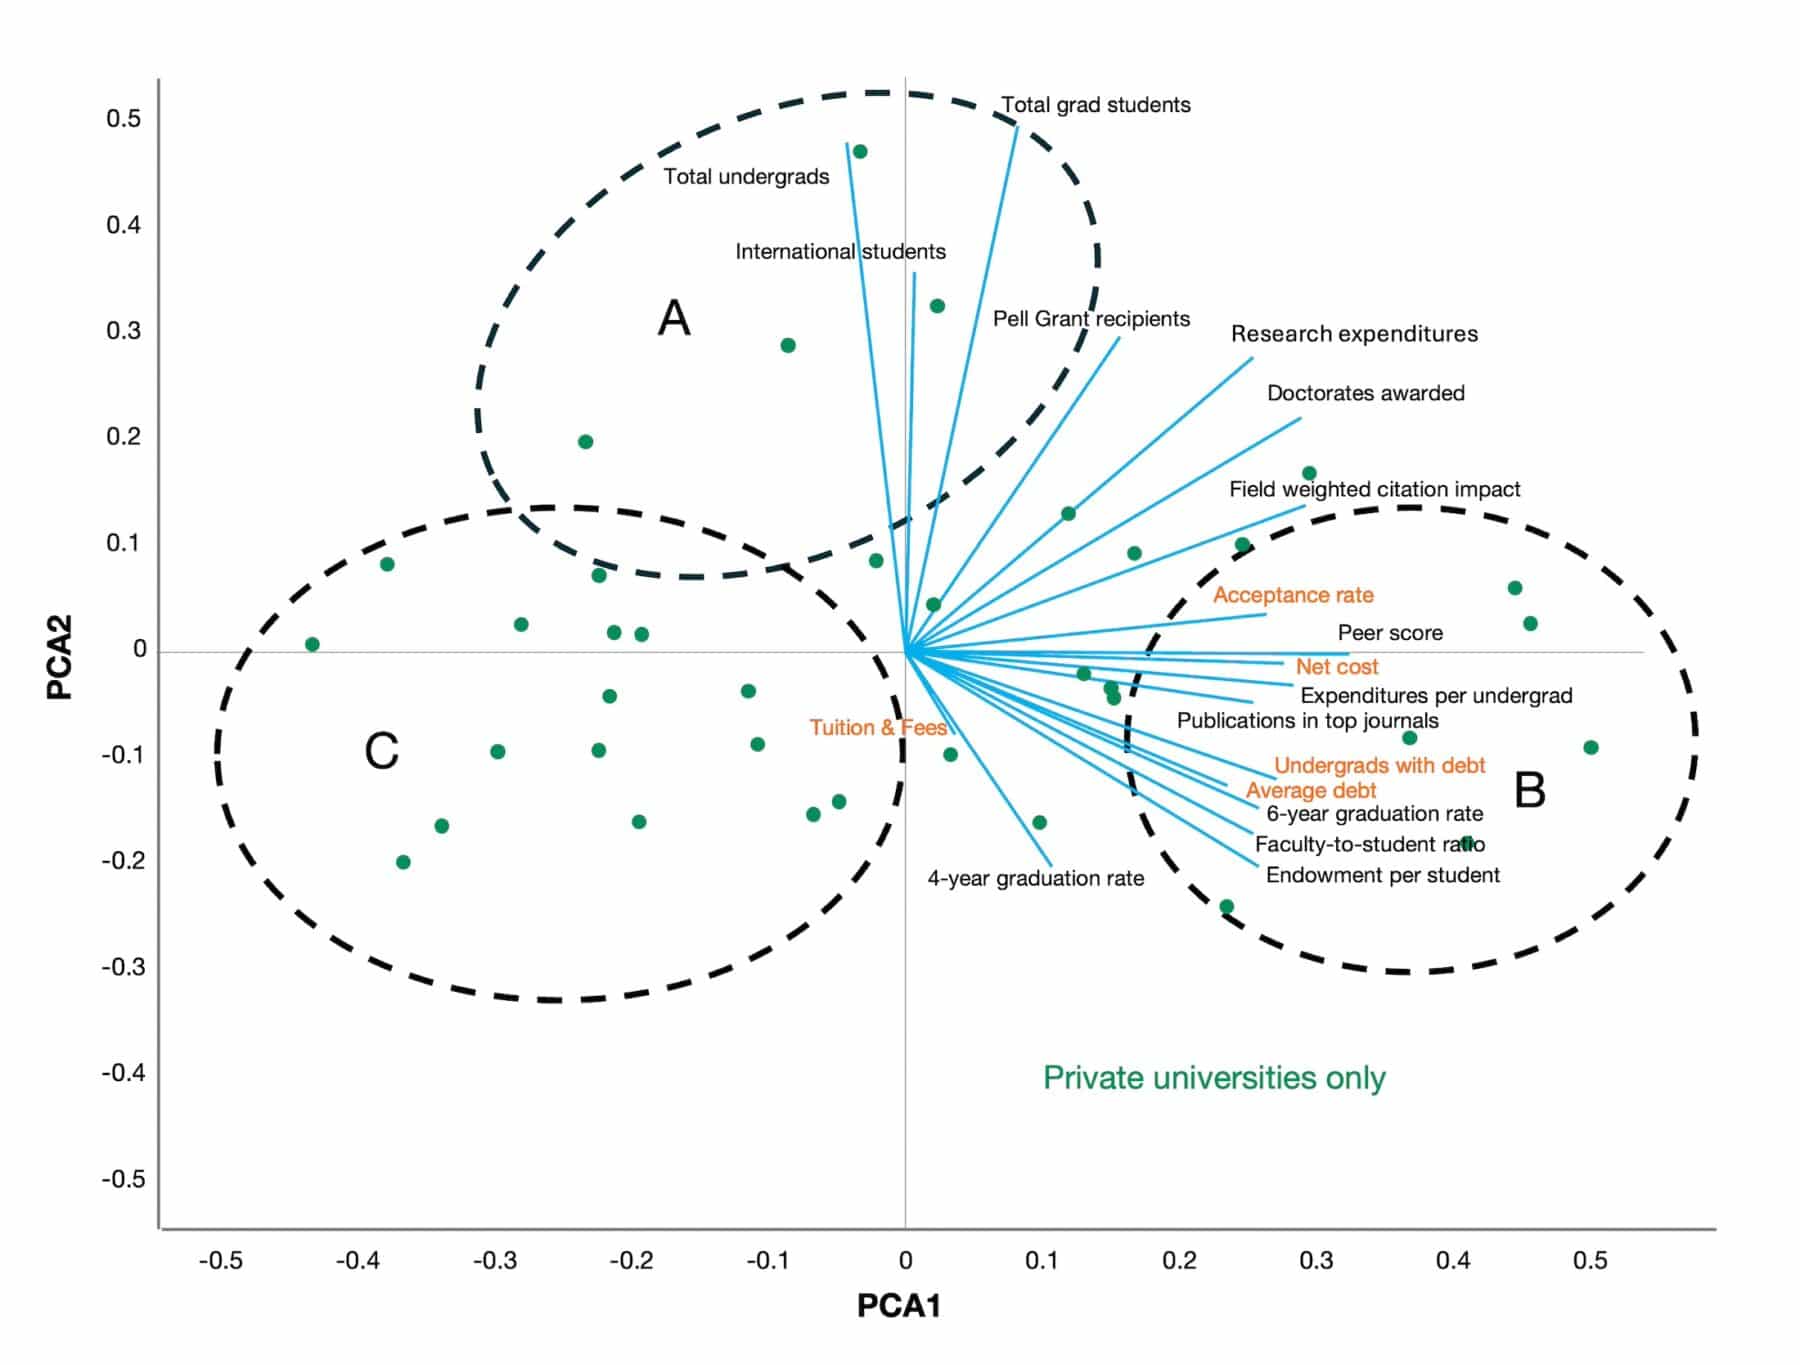
B = Elite private universities with high peer scores, low acceptance rates, high graduation rates, and high endowments per student
C = Smaller student bodies, lower endowments per student, and smaller research spending
Biplot of first two PCA components for private institutions only with endowment per student added as the 19th feature. PCA1 captures 45% of the variance, and PCA2 captures 16% of the variance; the remaining 17 components represent the rest of the variance.
Three clusters emerge in the second analysis. Elite universities with the largest endowments and high scores in the features that measure quality (peer scores, selectivity, graduation rate, etc.) make up one cluster. The second cluster is of private universities with large undergraduate and graduate student bodies. These larger institutions are hybrids; they resemble the state flagships, but with higher tuition and net cost, using scale to drive revenue but in some cases sacrificing features associated with the highest quality institutions. The third cluster is of smaller private institutions dependent on tuition. By keeping enrollment low, they can increase revenues only by increasing tuition or by receiving gifts. For institutions without another way to grow revenue, cost cutting becomes an important option.
In my analysis, higher percentages of Pell students are connected to the cluster of state universities, indicating the important role of these institutions in providing access to undergraduate education.
Without relying on a ranking, my analysis demonstrates what is widely known: the leading private research universities seem to be in a class by themselves, influenced mostly by metrics of perceived quality and not by cost. Although these schools have high tuition, they are able to award generous need-based financial aid. State universities are at the other end of the spectrum, keeping to their missions of access and workforce development by holding down in-state tuition while increasing student numbers to boost revenue.
Institutions without large endowments are forced to generate revenue growth through tuition and fees, either by charging more or by enrolling more students. The steady increases in undergraduate and graduate enrollments over the last decade indicate use of this strategy. Its success depends on universities’ reputations and abilities to deliver quality education and experience to an increasing number of students. With numbers of high school graduates expected to decline over the next decade, a competitive scramble for students could force the least competitive schools to downsize expensive research programs. Is that kind of competition among US research universities sustainable?
My analysis points to the growing fragility of the system of US research universities, with the public and private schools responding to different pressures, and smaller private schools (and many state universities) without large endowments struggling to stay competitive. This leads to two questions: Can the country accept the consequences if the number of research universities dramatically shrinks because fewer can afford to keep pace? And can the United States remain a global leader in innovation if our research universities don’t thrive? At such a juncture, it is time to take a careful look at the health of the enterprise as a whole to envision its future.