Four Technologies and a Conundrum: The Glacial Pace of Energy Innovation
A first-of-its-kind analysis provides a sweeping picture of how the United States uses energy and suggests steps for technological improvement.
The energy sector is the world’s largest market. Reaching billions of users, it accounts for approximately $5 trillion of economic activity and $1.8 trillion of trade annually, representing trillions of dollars of accumulated long-lived capital investments. At the same time, the energy sector is under pressure to change to meet a variety of market and societal pressures. In particular, population and economic growth are driving up total demand; urbanization and industrialization are changing the end uses of energy (toward electrification and transportation); and social concerns about national security and the environment are causing many countries to revamp their primary sources of energy (toward domestic low-carbon options or sustainable options, or both).
Although it is a widely accepted idea that the pace of innovation is accelerating in many fields—especially in consumer electronics—it is not clear whether this phenomenon holds true for the energy industry. Understanding the vintage of the energy industry’s current technological configuration might provide a helpful indicator of its ability to adopt new technologies.
The mix of fuels for the global energy system has been closely tracked for decades by a number of agencies and through a variety of reports with precise records of energy prices, consumption by end-use sectors, and flows of primary energy resources. But the mix of technologies that convert those fuels into useful outcomes has not been quantified, nor are they routinely tracked by reporting agencies, analysts, or observers. Although fuels and end uses are important, it is our contention that conversion technologies also deserve attention.
We have tackled this knowledge gap using the United States as a case study to quantify the energy system’s dependence on discrete energy conversion technologies (by fuel and end-use sector). Although many of the underlying data that we used have been known for a long time, to our knowledge this analysis is the first that comprehensively sorts energy consumption by conversion technologies and quantitatively couples those technologies to the primary fuels and end-use sectors. This assessment leads to some forward-looking recommendations for policymakers and analysts.
Calculating the fuel mix
Four end-use sectors—transportation, industry, commercial, and residential—are responsible for U.S. energy consumption, which in 2010 totaled 98.01 quadrillion British thermal units (BTUs), or quads, according to data from the Energy Information Administration (EIA). By sector, transportation was responsible for 27.51 quads, industry for 30.14 quads, commercial for 18.21 quads, and residential for 22.15 quads. Electricity generation, which accounts for approximately 40% of annual primary energy consumption, is sometimes separated out as its own sector. In this scenario, electricity was responsible for 39.58 quads, transportation for 27.43 quads, industry for 19.98 quads, commercial for 4.18 quads, and residential for 6.84 quads.
These end-use sectors consume various types of fuels, or primary energy sources. In 2010, fossil fuels provided 83% (81.44 quads) of the quads consumed. Among this group, petroleum provided 35.97 quads, natural gas 24.65 quads, and coal 20.82 quads. (Individual totals may not match the cumulative total because of rounding errors in the data.) Nuclear power provided another 8.44 quads. Renewable sources collectively provided 8.05 quads: 4.3 quads from bioenergy, 2.51 quads from hydroelectric, 0.92 quads from wind, 0.21 from geothermal, and 0.11 quads from solar thermal and photovoltaic (PV). From this spectrum, it is apparent that 92% of U.S. energy is produced from only four primary fuels: petroleum, natural gas, coal, and nuclear.
This information is depicted in Figure 1, which is the famous “spaghetti graph,” produced by researchers at Lawrence Livermore National Laboratory that charts the flows of energy consumption from the primary fuels to the end-use sectors. The graph quantitatively reveals many things about the U.S. energy system. For example, it illustrates that the transportation sector is predominately fueled by petroleum, that coal is closely coupled with power generation, and that a majority of energy consumption is released as rejected energy (or waste heat).
FIGURE 1
Energy use by fuels (left side) and end-use sectors (right side)
All numbers in quadrillion BTUs
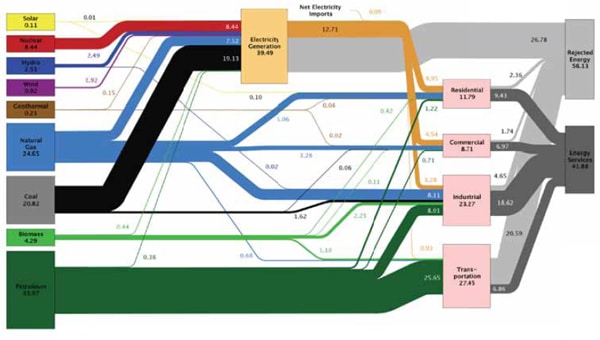
Source: Energy Information Administration and Lawrence Livermore National Laboratory.
Missing information
Although the EIA’s data reveal a wealth of information about fuel sources and prices, no agency has focused specifically on summarizing annual energy use by conversion technology. However, EIA does publish some data about various conversion devices for the power sector and about various appliances in the commercial and residential sectors. Thus, by carefully reviewing, integrating, and synthesizing data from those and additional EIA reports, we were able to produce a reasonably complete picture of energy conversion technology deployment.
Technology-specific information is known in greatest detail for electricity generation. These technologies include steam turbines, combustion turbines, binary turbines (such as those used in geothermal applications), hydraulic turbines (used with hydroelectric dams), internal combustion engines (used primarily with gasoline and diesel fuel, but also with natural gas), wind turbines, and solar photovoltaic panels.
In other sectors, we had to comb through EIA reports and other data sources and make a number of logical assumptions about technology allocations. A few examples may be illustrative. For the transportation sector, we assumed that all gasoline and ethanol would be consumed in spark-ignition engines, whereas diesel and biodiesel would be consumed in compression-ignition engines. In the industrial sector, we focused on a number of key devices, including boilers, burners, and heaters, that use the most energy. At the commercial and residential scales, widely used appliances comprise such things as space heaters, water heaters, and ovens. Regarding solar energy, although many reports aggregate solar thermal and PV, we separated them, assigning PV (which makes electricity) to the power sector category and end-use solar thermal to the appliance category.
Given its diverse applications, allocating natural gas across the various technologies proved most complicated. Much of natural gas is consumed directly in appliances at the end-use sectors, but it also is consumed in boilers for use with steam turbines, in combustion turbines, and in combustion turbines as an intermediary with steam turbines for generating power in combined cycles. Determining the allocation of natural gas across these sectors required reconciling the information from the power sector data with other data on industrial and residential energy use. In addition, the combustion turbine has two distinct applications: consuming natural gas to generate electrical power (stationary) and consuming jet fuel to generate thrust for transportation (aviation).

The results of our analysis are summarized in Table 1 and illustrated in Figure 2.
As Table 1 and Figure 2 show, four conversion technologies—the steam turbine, combustion turbine, spark-ignition engine, and compression-ignition engine—are responsible for 65.4% of all energy consumption in the United States. The steam turbine (30.59 quads) for power generation and the spark-ignition engine (17.41 quads) for transportation are the two dominant technologies. These are followed by the combustion turbine (9.30 quads), which is primarily for power generation and transportation (aviation), and the compression-ignition engine (6.78 quads), which is primarily for transportation but also has some uses in power generation.
Another 25% of all energy consumption can be attributed to two other (relatively large) categories: industrial devices (primarily boilers, burners, and heaters), and a number of smaller and more varied appliances in the residential and commercial sectors. In addition, nearly 5 quads of energy are consumed as feedstock in making products and materials through a variety of chemical pathways. Rounding out the list are hydroelectric turbines, compressors, and pumps (for pipelines), wind turbines, binary turbines, and solar PV systems.
Within the power and transportation sectors, the dominance of the four leading conversion technologies is even more extensive. Of the 39.6 quads consumed for electricity generation, 90% is provided by the steam turbine (at 75%) and combustion turbine (at 15%) alone. Hydroelectric, wind, solar PV, and binary turbines make up the other 10%. Similarly, transportation is dominated by two technologies: of its 27.4 quads of consumption, 86% is provided by the spark-ignition engine (62%) and compression-ignition engine (24%).
Benchmarking vintage and efficiency
In contrast with the concept of accelerating innovation, the four leading technologies that we identified were, by and large, invented or first demonstrated well over a century ago. The combustion turbine for stationary applications was invented in 1791 by John Barber, the fuel cell in 1842 by Sir William Robert Grove, the spark-ignition engine in 1876 by Nicolaus Otto, the hydroelectric turbine in 1878 by William Armstrong, the solar PV cell in 1883 by Charles Fritts, the steam turbine in 1884 by Charles Parsons, the wind turbine in 1888 by Charles F. Bush, and the compression-engine engine in 1893 by Rudolph Diesel. The most recent is the combustion turbine for aviation applications, invented by Frank Whittle in 1930—still almost a century ago.
In other words, the electricity that powers the advanced hallmarks of the industrialized world (consumer electronics, medical diagnostics, and communications technologies) is generated predominately by late–19th-century technology: steam, hydroelectric, and combustion turbines. Specifically, there was a flurry of innovation over a two-decade span in the late 1870s to early 1890s that yielded most of the conversion devices that power the modern economy.
The modern transition from fossil fuels to renewable energy in the electric industry is primarily to wind and solar power (with biomass and geothermal looming on the horizon). Yet even the wind generator and solar cell technologies date back to the 19th century. Nuclear fission (first demonstrated in 1938, one year after the combustion turbine for aviation applications) is a newer fuel source compared with coal, but it still relies on the same old steam turbine. And the first nuclear power plant was connected to the grid in 1954, almost 60 years ago.
FIGURE 2
Annual U.S. energy use by conversion technology (and fuel and end-use sector) in 2010
All numbers in quadrillion BTUs, based on various sources from the Energy Information Administration
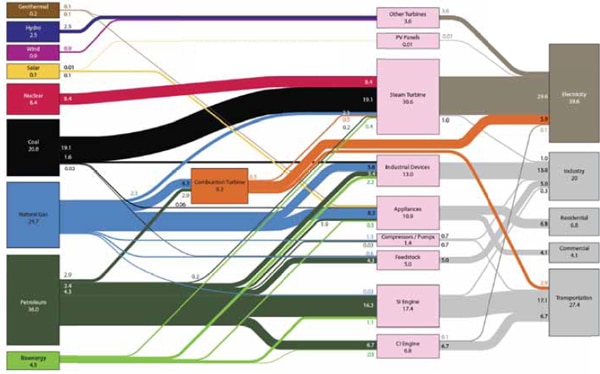
Source: M.E. Webber, UT Austin © 2012.
Solar and wind still meet just a small fraction of annual energy needs. Although improvements in efficiency have greatly increased the performance of these technologies, the fundamental conversions remain the same as in the first solar and wind demonstrations in the 1800s. Thus, even modern fuels such as nuclear still use old technology, and the modern technologies that are available for application in the near term are not as new as commonly thought.
It might therefore be concluded that fundamental innovation in power and transportation technology is slow: Power production does not appear to have an equivalent to the Moore’s Law pace of rapid innovation in the performance and efficiency of microprocessors. This difference has created a strategic problem for planners, who often seem to be betting on breakthroughs to solve the challenges of the energy system. In contrast, the historical record implies that innovation in energy conversion devices is actually quite slow and breakthroughs rare. Thus, the hope that a new technology will come along that suddenly solves the challenge of greenhouse gas emissions seems naive.
The dominance of four technologies makes the transition to an economy based on renewable energy even more challenging. The advances made in renewable energy power production to date have made little headway into the transportation sector. Although market penetration of electric vehicles into the markets for cars and light-duty trucks is growing exponentially in the United States, the major economic sectors of international shipping, freight railroads, and aviation are dependent on technologies that cannot be easily powered by wind or solar electricity generation. Although a push could be made for a fundamental technology change in transportation to displace the internal combustion engine or gas turbine, recent policy directives seem to prefer finding a renewable-based liquid fuel that can “drop in” to the existing technology mix.
A pathway ahead
If history can be any guide, then, it can be expected that the transition to a zero-carbon economy based on renewable energy sources using new conversion technologies will probably be slow, at best. Therefore, it would be unwise to expect new “breakthrough” technologies to suddenly solve the nation’s energy problems as society continues to depend heavily on incremental improvements to old technologies. Drop-in fuels might move faster because of compatibility with existing infrastructure that is typically slow to change, but those drop-in fuels have the downside of propagating older technologies.
Although the conversion devices listed in Table 1 have served the nation well for over a century, the most prevalent four systems involve a relatively inefficient step of converting thermal energy into motion. The relative inefficiency of that conversion yields significant waste heat and higher-than-necessary fossil fuel consumption. Thus, finding a way to bypass that step with some fundamentally different conversion approaches would be valuable. Today’s solar PV and wind turbines bypass the thermal conversion step, thereby avoiding the wasted heat, which is one reason why they are appealing. There are more potential pathways than can be comprehensively identified here, but a few are worth mentioning. The existence of bioelectric organisms, such as electric eels, that convert chemical energy into electrical energy directly presents an opportunity to harness this novel pathway through bioelectric power systems, such as microbial fuel cells, biological solar voltaic, piezoelectric protein skins, or photoactive fuel cells. Some people have even touted the controversial Casimir effect, which is claimed to convert atomic forces at submicrometer scale into forces that can induce motion. If proven, it could potentially be used as a pathway for using nuclear fuels to generate motion while bypassing the steam turbine.
In light of this analysis, we have several recommendations for energy policymakers in the United States and elsewhere:
• The EIA should track technology deployment as well as fuels. The EIA has remarkable capabilities for collecting data and performing analysis on energy consumption and flows. We recommend that the agency include in its Annual Energy Review a table and graph in the overview chapter similar to Table 1 and Figure 2 in this manuscript. Such information is already available in a disaggregated format throughout the rest of the annual report and could readily be assembled using reasonable assumptions (and inputs from a handful of other EIA reports) by EIA analysts. Although the existing body of information reported by the agency is already world-class, we believe these additions would yield additional insights about technology innovation in the energy sector.
• The United States should invest in R&D for new fundamental energy conversion technologies (in addition to fuels and incremental improvements in existing energy conversion technologies) and concentrate on energy conversion pathways that reduce waste heat. A vast preponderance of energy research has emphasized developing alternative fuels with the same old technologies, such as new biofuels for old spark-ignition engines, rather than seeking to reduce consumption through efficiency improvements or the development of alternative technologies. However, presumably there are many innovations in energy conversion waiting to be discovered, given the right support. These might be as simple as efficiency improvements to the existing technologies, innovations in the small-scale but newer conversion devices (including solar PV and solid-state devices such as fuel cells), the integration of existing systems (novel power cycles), or wholly new conversion pathways.
• Policies that can accelerate technology development and adoption at scale should be emphasized. Accelerating the deployment of renewable energy technology will be the key to making a nontrivial impact on global emissions and resource depletion before the end of this century. In particular, policies that focus on accelerating the transition and adoption of a more diverse set of conversion pathways should be encouraged.
Due to the nation’s continued dependence on 19th-century technology and the logical expectation that technology transitions will probably take many decades at best, it is imperative that policies to promote conversion technology development and commercialization be put in place soon. The transition is going to take a long time, so we might as well get started.