China and India: Emerging Technological Powers
Asia’s economic groundswell is no longer breaking news, but the critical details of this transformation and its staying power are just coming into focus.
Although the growing economic stature of China and India is widely recognized, the factors underlying their success are still not well understood. The advantage of a large low-wage workforce is apparent to everyone, but that can never be the foundation of an economic superpower. True economic leadership comes only with the ability to produce high-quality high-technology goods and services and to create innovative new products and technologies. To appreciate the long-term potential of China and India, we need to take a comprehensive look at their innovative capacity.
China and India are the two most populous countries, accounting for 20.4% and 17.0% of the world’s population. Although they are still developing countries with per capita incomes of just $1,740 and $720 (2005), they already are the fourth and eleventh largest economies in the world at nominal exchange rates. However, in terms of purchasing power parity (PPP), they already have been for some time the second and fourth largest economies. Moreover, they are growing more than three times faster than the world average. Even though the percentage of persons with higher education in their populations is still low by developed country standards, because of their enormous size, they have a critical mass of highly educated people and of scientists and engineers. In addition, they have a critical mass of expenditures on R&D. As a result they have a large innovation capacity that is being deployed not only for their own needs but also to perform R&D for multinational companies. They are becoming increasingly important players on the global stage.
Innovation in China and India should be understood to include not just knowledge that is new to the world, but also knowledge that is new to these countries. It is important to consider this second dimension of innovation because it helps to understand why these economies are growing so fast and how rapidly they are likely to grow in the future.
Illustrious histories
China and India are among the world’s oldest civilizations, stretching back three to four millennia. To put their current rising prominence in perspective, it is useful to briefly review their relative importance over the past two millenniums. For most of the first millennium AD, China and India accounted for a quarter and a third of total world economic activity. During the last 200 years of the first millennium and for most of the second millennium they lost prominence with the rise of Japan and Western Europe. This loss of relative economic size was particularly rapid in the past 250 years, a period of rapid economic growth in Western Europe, the United States, and Japan. The main reason for this was not that their economies collapsed, but that they missed the Industrial Revolution. Thus, they did not benefit from the rapid growth that came to the countries that pioneered and quickly adopted industrial production technology.
In the past 25 years China and India have been rapidly increasing their share of global gross domestic product (GDP). To a large extent it is because they are tapping into global knowledge and integrating themselves more into to the global economy. They are re-emerging as major global players.
Roughly in the middle of the 20th century both countries underwent a radical regime change. India won its independence from England in 1947, and Mao’s communist revolution triumphed in China in 1949. Initially, both countries followed a development strategy heavily influenced by Russia, including five-year industrial development plans marked by state control of the economy and strongly autarkic trade policies.
China began to move to a market economy and to open itself up to the rest of the world in the late 1970s. Its pace of reform speeded up in the 1980s and the 1990s. This included the proliferation of special economic zones, increasing receptivity to direct foreign investment, and the decision to join the World Trade Organization in 2001. Since then, the movement to a market economy has accelerated with the growing recognition of private property rights and rapid integration into the world’s trading system. China is now a major global player on the world trade and investment scene. The speed, scope, and scale of its entry into the global system are unprecedented in economic history. It has been growing at 8% to 10% per year since the late 1970s and has become the third largest exporter of merchandise goods. It has earned the reputation as the manufacturing center for the world.
India began relaxing its tight grip on the private sector in the late 1980s, and its rate of growth began to increase. However, it over-borrowed on the international capital market and suffered a major financial crisis in 1991. To overcome that crisis, India undertook some trade liberalization, further loosening of the controls on business, and some gradual opening to direct foreign investment. These measures boosted its rate of growth from an average of 2% to 3% since independence to 6% in the 1990s. Since the turn of the century, it has undertaken some further liberalization of business regulations, trade, and openness to foreign investment. In the past three years, its rate of growth has increased to 8% per year. Much of this recent growth has been driven by its rapid expansion of information technology (IT) enabled services, business services, commerce, and banking. Internationally, India has acquired a reputation as the IT-enabled service center of the world.
Current conditions
In 1980, the per capita income of China and India were roughly equal at about $250. Because of China’s faster rate of GDP growth in the past 25 years, its GDP per capita in 2005 was $1,740, compared with $720 in India. The life expectancy in China is 8 years longer than it is in India. In 2005, China’s population was 30% larger than India’s, and the size of the Chinese economy was roughly three times India’s. For comparison, the U.S. economy is almost six times as large as the Chinese economy with less than one quarter of its population (see table 1).
One of the reasons for China’s faster growth has been its much higher investment rate. In the past 10 years, for example, investment has averaged 36% of GDP in China and 25% in India’s. Another reason for China’s high per capita income growth is that as a result of its one-child policy, its average annual population growth during the period 19902004 was only 0.9%, compared with India’s rate of 1.7 %. Demographers project that by 2040 India will surpass China to become the world’s most populous country.
As a result of India’s much higher population-growth rate, the population age pyramid is much wider at the bottom in India than in China or the United States. Nearly one-third of the population in India is less than 15 years old. China will be facing the challenge of a more rapidly aging population and a rapidly increasing dependency ratio. India has the demographic surplus of much younger population, but it needs to educate that young population to reap its benefits. Both China and India are still largely rural economies— 60% of the population in China, 71% in India.
The rapid per capita growth rate in China has helped to lift many people out of poverty. The share of persons below the international poverty line of $1day has been reduced to just 17% in China. In India the share of persons below the $1/day poverty line has also been reduced, but to 35%. In addition, in both countries a large share of the population is just barely above this poverty line. The percentage earning less than $2/day 47% in China and 52% in India. Moreover, there has been a significant increase in inequality as result of rapid and uneven growth. In China, the gini coefficient (a measure of income inequality that ranges from 0 for perfect equality to 1 for complete inequality) has increased from 0.30 in 1990 to 0.45 in 2000, which is higher than the U.S. rate. In India is was just 0.32 in 2000, but it is most likely to have been increasing over the past five years as a result of India’s recent unevenly distributed growth.
China has advanced much more rapidly than India in improving literacy and overall educational attainment. Literacy in China is 91%, but only 61% in India. The average educational attainment of the Chinese population 15 years old and above in 2000 was 6.4 years in China and only 5.0 in India (compared to 12 in the US and most other developed countries). Moreover, in the past 10 years, China has been investing very heavily in expanding its higher education system. China raised its tertiary enrollment rate from 5.3% of the population of the tertiary age cohort in 1995 to 19.1% by 2004. India, on the other hand, increased its rate from 6.6% in 1995 to 11.8% by 2004. The tertiary enrollment rate in the US is 82.4%, one of the highest in the world. However, as of 2005 there were a greater absolute number of tertiary students in China than in the United States, and 40% of them were studying math, science, or engineering.
The overall quality of tertiary students from China and India is still very low. Nevertheless, the graduates of the best institutions are very capable and are one of the main reasons why there is so much foreign investment in R&D facilities by U.S. companies in China and India. Also, the large number of Indian graduates who are fluent in English has been one of the main reasons for India’s reputation as the source of off-shored services than can be delivered over the Internet.
The Chinese economy has undergone significant industrial restructuring over the past 25 years. Agriculture’s share of GDP has fallen to 13%, while industry’s share has risen to 46%—one of the highest percentages in the world. The Indian economy has not undergone such drastic structural change. Agriculture’s share of GDP is still 21%, and industry’s share is just 27%. In fact, the share of the manufacturing sector has not changed over the past 20 years. However, there has been a significant growth of the service sector. Part of this has been forced growth of self-employment in low-value service activities because the modern sector of the economy has not been able to absorb the rapidly growing labor force. However, there has been a rapid increase in high-value business services. These include not just offshore services, but also the establishment of many banking and consulting service operations in India, including many managed by major multinational companies such as General Electric, IBM, other technology firms, and investment banks.
TABLE 1
Basic Economic Indicators China, India and US
| China | India | US | |
|---|---|---|---|
| GDP | |||
| GDP (2005 nominal billion) | 2,229 | 786 | 12,455 |
| GDP/capita (2005 nominal) | 1,740 | 720 | 43,500 |
| GDP/capita( 2005 PPP) | 6572 | 3486 | 41,853 |
| Growth of GDP | |||
| 1990-2000 | 10.6 | 6.0 | 3.5 |
| 2000-2005 | 9.5 | 6.8 | 2.7 |
| 2005-2006 | 9.9 | 8.5 | |
| Investment as % of GDP (av. 1995-2004) | 36.1 | 24.8 | 19.1 |
| People | |||
| Population (2005) | 1,304 | 1,100 | 297 |
| Population growth rate (annual av. %) | |||
| 1990-2004 | 0.9 | 0.6 | 1.7 |
| 2004-2220 (expected) | 1.3 | 1.2 | 0.9 |
| % population below 15 years old (2004) | 22.0 | 32.5 | 20.9 |
| Estimated population 2020 | 1,424 | 1,332 | 338.4 |
| % population rural (2004) | 60 | 71 | 20 |
| Life expectancy at birth | 71.4 | 63.5 | 77.4 |
| Poverty | |||
| Gini Coefficient (2000) | 44.7 | 32.5 | 40.8 |
| People living below $1/day (2000-2001) | 16.6 | 34.7 | na |
| People living below $2/day (2000-2001) | 46.7 | 52.4 | na |
| Education | |||
| Literacy rate, population 15 & above 2004 | 90.9 | 61.0 | 100.0 |
| Av. Ed. Attainment of Adult Pop. (2000) | 6.35 | 5.06 | 12.00 |
| Secondary Enrollment Ratio (2004) | 72.5 | 53.5 | 94.8 |
| Tertiary Enrollment Ratio (2004) | 19.1 | 11.8 | 82.4 |
| Structure of Economy (2004) | |||
| Agriculture | 13 | 21 | 1 |
| Industry | 46 | 27 | 22 |
| Services | 41 | 52 | 77 |
| Information & Communication Tech. | |||
| Fixed and mobile phones per 1000 Persons (2004) | 499.4 | 84.5 | 1,222.7 |
| Computers per 1000 persons (2004) | 40.9 | 12.1 | 749.2 |
| Internet users per 1000 persons | 72.5 | 32.4 | 630.0 |
| Environment | |||
| Renewable internal freshwater resources per capita (cu. meters -2004) | 2,170 | 1,167 | 9,535 |
| Arable land (hectares) per capita | 0.11 | 0.15 | 0.60 |
| Energy use/capita (kgs oil equiv. – 2003) | 1,094 | 520 | 7,843 |
| GDP per unit of energy use (2000 PPP per kg of oil equivalent- 2003) | 4.5 | 5.3 | 4.5 |
Source: World Bank KAM 2006, and World Development Indicators 2006
Tapping global knowledge
One of the main differences in the development strategies of these two giants is the extent, timing, and means through which they have acquired global knowledge. It is also part of the explanation for their different performance and growth paths. As a broad characterization, China has embraced globalization and has been benefiting very much from this. India has been much more autarkic and circumspect. It opened up much later and much more slowly, and is still not as integrated.
The main means of tapping into global knowledge are trade, foreign direct investment, technology licensing, copying and reverse engineering, foreign education and training, and accessing foreign technical print information and through the internet (see Table 2 for comparative data on all but the last of these means). On all these counts, China has been more aggressive and systematic than has India
TABLE 2
Acquiring Global Knowledge
| China | India | US | |
|---|---|---|---|
| Trade as Share of GDP (2004) | 65.30 | 41.60 | 23.7 |
| Manufactured trade as % of GDP (2004) | 50.35 | 15.29 | 15.47 |
| Merchandise exports ( US billions) | 593.3 | 75.6 | 818.8 |
| Merchandise exports % of GDP | 30.7 | 10.9 | 7.0 |
| (Manufactured Exports % of merchandise exports) | 91 | 88 | 82 |
| (High tech exports % of manful. exports) | 30 | 5 | 32 |
| Commercial service exports (Us billions) | 62.1 | 39.6 | 321.8 |
| Commercial Service Exports % of GDP | 3.2 | 5.7 | 2.7 |
| (IT services as % of Service Exports) | 38.3 | 66.4 | 44.8 |
| Tariff & Non Tariff Barriers* (2006) | 3.00 | 5.00 | 2.00 |
| Gross Foreign Investment as share of GDP (av. 2000-2004) | 3.89 | 0.68 | 1.37 |
| Royalty and license fee payments ($ mil 2004) | 4,496.6 | 420.8 | 23,901 |
| Royalty and license fee payments/million population (2004) | 3.47 | 0.40 | 81.38 |
| Students studying abroad (2004) | 381,330 | 129,627 | 46,547 |
Source:World Bank KAM 2006, except for student studying abroad, which is from OECD, Education at a Glance 2006.
Trade. China began opening up to the world much earlier than did India and has became much more integrated into the global economy. The share of imports and exports in China was 67% of GDP in 2004 compared with only 42% in India (see Table 2). China’s high degree of trade integration was second only to Germany’s among the world’s large economies at the time, and it is likely that it has surpassed Germany by now. Purchases of foreign products and services are a key way to gain access to knowledge embodied in those goods and services. Unlike China, which has significantly removed tariff and non-tariff barriers to trade as part of its joining the WTO, India is still one of the most closed economies in the world. Having to export in competition with the rest of the world also forces exporters to keep up with the new products, designs, and process technologies, quality improvements, and even new business models of competitors. Also, having close exposure to foreign goods and services provides greater opportunity to copy and reverse engineer them.
Foreign Direct Investment. The inflows of foreign direct investment into China have been several multiples those into India (Table 2). This is the result of several factors. First, China opened up it regulatory regime towards foreign direct investment earlier and wider than did India. Second, China’s larger and richer market has been an important pull factor. Third, China has many cost advantages over India even though its labor costs are now generally higher than India’s: Transportation is more efficient, service infrastructure is more developed, and the red tape for trade in physical products is less burdensome. As a result, China has been very attractive not just as the world’s fastest growing market, but also as a production platform for global operations. This strong pull of producing in China has also permitted the government to encourage strong competition among foreign multinational firms to bring their very best technology when they locate in China, even though they are very aware of poor intellectual property protection and the risk that their technology will be pirated.
Technology licensing. China has also been much more aggressive in licensing foreign knowledge through formal technology-licensing agreements. Chinese royalty and fee payments are more than ten times those of India.
TABLE 3
Formal Innovation Inputs and Outputs
| Indicator | China | India | US |
|---|---|---|---|
| Researchers in R&D, 2004 | 926,252 | 117,528 | 1,334,628 |
| R&D researchers per million population, 2004 | 708 | 119 | 4,605 |
| Spending on R&D (US$ billions), 2004 | 27.8 | 5.9 | 313.9 |
| Spending on R&D (percentage of GDP) 2004 | 1.44 | 0.85 | 2.68 |
| Scientific and technical journal articles, 2003 | 29,186 | 12,774 | 211,233 |
| US$ 1000s of R&D spending per scientific and technical article * | 953 | 462 | 1,482 |
| Scientific and technical journal articles per million population, 2003 | 22.7 | 12.0 | 726.4 |
| Patents granted by U.S. Patent Office, (2004) | 597 | 376 | 94,110 |
| US$ millions of R&D spending per patent granted * | 46.6 | 15.7 | 3.3 |
| Patent applications granted by U.S. Patent Office per million population (2004) | 0.46 | 0.34 | 320.1 |
Source: Compiled from data in KAM 2006 and World Bank 2006
* Calculated by dividing estimated R&D spending in 2004 by number of articles or patents in same year.
Foreign education. China has been sending more tertiary level students abroad for education and training, even now that it has a much larger tertiary education system than India in absolute and relative terms. In 2004, more than 15% of all the 2.7 million students studying outside their home country were from China (not counting Hong Kong), and 5% were from India. Foreign education and training are very important means to tap into global knowledge. These students not only learn what they study, but a large number of them are the researchers at higher education institutions around the world. Many also go on to work in the high technology firms in the United States and Europe. Until a few years ago, many of them stayed on in their host countries. However, in the past five years more of them are returning to China and India, in part because of increasing opportunities in their home countries and attractive incentive programs designed by their home countries to stem this brain drain. The United States has encouraged this trend by responding the 9/11 attacks by making it more difficult for foreigners to obtain student visas.
Copying and reverse engineering. Greater access to foreign knowledge through all the formal channels listed above, higher levels of human and technological capital, and a policy (now changing) of ignoring intellectual property rights laws have given China an advantage in copying and reverse-engineering foreign technology.
R&D investment and activities
Overall, tapping into global knowledge has been much more important in improving the productivity and growth of these economies than has innovation coming from their R&D effort. However, both countries have critical mass in R&D and are increasing the amount of R&D they are undertaking, as well working on improving the efficiency of that R&D. The strength of these two countries can be seen in many areas such as their nuclear, space, and biotechnology programs. An examination of R&D inputs and outputs will shed light on their relative strengths and weaknesses.
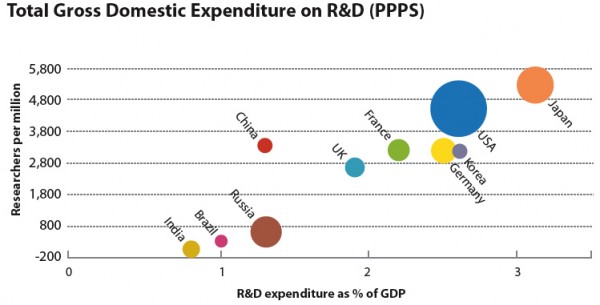
Inputs. The most common input measures are scientists and engineers doing R&D and expenditures on R&D. The number of scientists and engineers doing R&D in China is now second only to the United States (see Table 3). The number for India is about an eighth of China’s, but there may some problems in the definitions. China has been ramping up R&D expenditures significantly since 2002. By 2004, it was spending 1.4 % of GDP on R&D (see Figure 1). It is estimated that by 2006 the percentage had increased to 1.6% of GDP. Thus, in 2007 China will be spending more in PPP terms on R&D than Japan, making it the world’s second largest spender. This still puts it far behind the United States, but the gap is narrowing. In the 15-year science and technology plan announced by the Chinese Government in 2006, the target is to increase R&D spending to 2% of GDP by 2010 and to 2.5% by 2020.
In India, for 20 years R&D spending as a share of GDP oscillated between 0.8% and 0.9%, and more than 70% of funding came from the government. However, in the past two years there has been increasing spending by the private sector, particularly in information and communications technology, autos, and pharmaceuticals. The bulk of the increase has come from multinational companies that have discovered India as a very cost-effective location for R&D. Alok Aggarwal of Evalueserve (a consulting firm) estimates that R&D expenditures in India are now 1.1% of GDP, and that the largest share now comes from the private sector.
Outputs. Two commonly used broad output measures are scientific and technical publications and U.S. patents. China has been increasing its number of scientific and technical publications very rapidly over the past few years. In 2003, it had more than twice as many publications as India, but only 14% of the U.S. total. India has also been increasing its scientific and technical publications, but not as fast as China. In addition, citation analysis reveals that China’s output is of higher quality than India’s.
Efficiency. A very crude measure of relative efficiency can be constructed by looking at technical publications and patents and per dollar spent on R&D in the three countries (Table 3). This is rough because it does not control for the quality of the outputs or for the different cost structures in the counties. The results are suggestive, nonetheless. India appears to be the most efficient, followed by China. This probably reflects the lower cost structures, particularly the salaries of researches. In terms of R&D cost per patent, however, the United States is the most efficient, followed by India and then China. This in part reflects the bias of choosing U.S. patents as the output measure. However, it probably also reflects that in both developing countries there is still more of an emphasis on science and technology than on commercializing it. Moreover, it is clear from more detailed analysis of the R&D systems in both countries that efficiency is still very low. However, both countries are focusing on improving the allocation, management, and monitoring of R&D as they know that it is increasingly important to improve their competitiveness.
R&D by multinational companies. A relatively recent development in both China and India has been increasing R&D by multinational companies (MNCs), which now operate more than 750 R&D labs in China and more than 250 in India. Part of the reason for this has been the need for MNCs to do R&D locally to adapt their goods and services to the domestic markets. In addition, MNCs increasingly have begun to set up R&D centers aimed at developing products and services for the global market. The initial motivation was the cost effectiveness of hiring relatively low-wage Chinese or Indian scientists and engineers. However, the rapidly growing demand has revealed that the supply of high-quality researchers was smaller than expected and salaries are rising rapidly. The limited supply of qualified researchers is this becoming a constraint on MNC-funded R&D, particularly in India.
GDP. Figure 2 projects the size of today’s 12 largest economies to 2015 in terms of PPP, assuming that they will continue to grow at the average rate they have been growing between 1990 and 2003. If these historical growth trends hold, India will surpass Japan in PPP terms by 2008 to become the third largest economy, and China will catch up to the United States by about 2013.
Clearly, these projections are inflated because they are in terms of purchasing power parity rather than nominal dollars. Nevertheless, they convey an accurate sense of the dynamism of these economies. But can China and India maintain their torrid rates of growth? China has been growing at an annual rate of 8% to10% for the past 30 years. India reached an 8% rate of growth just in the past three years, but it was growing at an average of 6% in for the decade of the 1990s. Most economists are likely to forecast that both China and India can continue rapid growth for another 10 to 15 years, though perhaps at 6% to 7% rather than 8%. The main reason for optimism is that both countries are still very far behind the global technological frontier. In any sector there is a very wide gap between the most productive and the least productive firms. Therefore, they can increase output rapidly by increasing the average productivity of firms to the local best practice as well as by improving local best practice to global best practice. China has done this more aggressively and thoroughly than has India, so India still has greater unexploited potential. In addition, now that both countries have achieved critical mass in R&D capacity, we can expect to see them reaching global standards in several sectors.
On the other hand, both countries face large internal challenges. Both have to confront growing regional and personal income inequality and environmental constraints. Additional challenges for China are a weak financial system and the tension between a one-party state and the transition to an autonomous market economy with an increasingly educated population. Additional challenges for India are the difficulty of generating consensus for critical reforms in a very diverse population still constrained by the legacy of the caste system, very high illiteracy rates (52% among women), and constraints on the expansion of the higher education system.
Trade. In terms of real dollars, instead of PPP, China is projected to surpass the United States as the world’s leader in merchandise exports in 2007. India’s exports have also been growing faster more recently, but India is still a relatively small player on the global export scene. One of the constraints on India’s exports is poor physical infrastructure, including not only electricity but also roads, ports, and railways. Another is the excessive bureaucracy and red tape that burden imports and exports. Indian policymakers are trying to address some of these constraints, and it is likely that there will be growth in Indian exports.
The expansion of trade from these two large economies will have positive and negative benefits on world trade. The benefits are increasing specialization and exchange, which will lead to reductions in the cost of products and services and an increase in global innovation. The world has already benefited from the lower cost of manufactured goods from China and IT-enabled services from India, and this is likely to continue for some time. Another benefit is the large and rapidly growing markets of these two large economies. As they continue to grow and prosper, they will be demanding more goods and services from the rest of the world, including the United States. They will also be attractive locations for direct and portfolio investment.
On the negative side, there are likely to be increasing adjustment and restructuring pressures as these two giant economies enlarge their footprint on global trade. Lower-cost goods and services will displace competing industries in the home and foreign markets of other countries, including the United States. Although the increase in imports by these economies should help balance their increase in exports, some parts of the world and some industries will face significant restructuring pressures. For example, the United States is experiencing stress in the textile, shoe, and garments industries, as well as in a host of services that can be digitized and out-sourced or off-shored to India. Some adjustment pain will be unavoidable, but the negative effects can be reduced to the extent that the U.S. economy can quickly redeploy resources and workers from the declining industries to new goods and services where the country is more competitive.
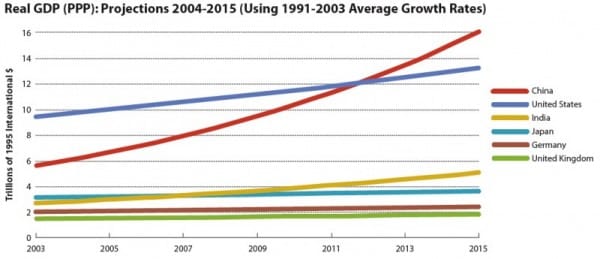
FIGURE 2: Real GDP (PPP): Projections 2004-2015 (Using 1991-2003 Average Growth Rates)
Source: Projected based on data in WDI.
Intellectual property rights. In the past quarter century the pace of the creation and dissemination of knowledge has accelerated. The nexus of global competitiveness has shifted from natural resources and other static advantages to innovation, and the market for knowledge and innovation has become increasingly global. Research is being done in more places, scientific and technical papers are more likely to have coauthors from different countries, and strategic technological alliances are more likely to include firms from more than one country.
Multinational corporations are becoming truly global, conducting R&D as well as production in many countries. This dispersion of high-level activity is generating anxiety about protection of intellectual property (IP). The relatively lax IP protection laws in China and India have been a particular source of concern. Both countries have begun efforts to align their IP rules with international norms, but enforcement is still weak in both countries. The complaints about IP violations tend to be stronger regarding China, probably because of the greater capability of its firms to reverse engineer or outright copy proprietary foreign technology. Although most multinationals investing in China and India know that their IP is likely to be pirated, they often cannot afford not to be in the Chinese or Indian market. They make their investments with the hope that they can innovate faster than they can be copied, but this is becoming increasingly difficult as the technological capability of these countries continues to improve.
The reigning economic assumption has been that as firms from developing countries gain greater capability and begin to move up the value chain, firms from developed countries invest more in high-level human resources and in R&D for innovation. That assumption must now be reconsidered in the light of reduced transportation and communication costs, the digitization and outsourcing of knowledge services, and the increasing ability for firms in developing countries to copy and reverse engineer. No longer able to simply outrun the competition from the emerging economies, the United States and other developed countries will have to pay closer attention to IP issues in their relations with China and India.
What next?
The United States and other developed countries have innumerable options for responding to developments in India and China. The only essential action is to make every effort to understand better what is taking place. Change is so rapid that information quickly becomes outdated. Even leaders in China and India are having trouble acquiring an accurate picture of where they stand in areas such as the number and quality of their engineers. There can be no doubt that China and India are becoming ever more important players in the global economy. The only way to succeed in this evolving global environment is to acknowledge it and study it.
Numerous opportunities for cooperation exist. The world is in desperate need of new clean energy technologies, and this need is particularly acute in China and India. All countries could benefit from cooperative efforts to develop environmentally benign ways to use coal. Likewise, international research into alternative energy sources, reforestation, land reclamation, water purification, and hazardous waste disposal could produce results with valuable environmental as well as economic benefits.
The growing buying power of hundreds of millions of poor people in China and India will create enormous demand for products such as a $10 cell phone, a $100 computer, and a $2,000 car. Producing these products could do wonders for the corporate bottom line as well as the quality of life of this population. At the same time, tens of millions of Indians and Chinese will be approaching the economic status of the middle class in the developed world. U.S. multinationals should be able to find almost unlimited opportunities to partner with firms in China and India to satisfy the needs of this market.
In short, these economies have come of age. Their re-emergence is both a challenge and an opportunity. What happens in these economies and how they interact with the rest of the world will have an effect not just on their future prospects, but also on those of the world. Given the many large and complex problems the world is facing, it is important to find and strengthen positive and mutually beneficial relationships.