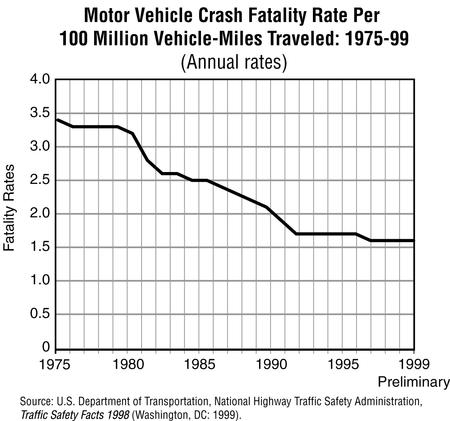
Past Progress, Future Problems
Fatalities by Transportation Mode
| Mode | 1970 | 1980 | 1990 | 1995 | 1998 | |
|---|---|---|---|---|---|---|
| Large air carrier | 146 | 1 | 39 | 168 | 1 | |
| Commuter air | N | 37 | 7 | 9 | 0 | |
| On-demand air taxi | N | 105 | 50 | 52 | 45 | |
| General aviation | 1,310 | 1,239 | 765 | 734 | 621 | |
| Highwaya | 52,627 | 51,091 | 44,599 | 41,817 | 41,171 | |
| Railroadb | 785 | 584 | 599 | 567 | 577 | |
| Transitc | N | N | 339 | 274 | U | |
| Waterborne | ||||||
| Vessel casualties | 178 | 206 | 85 | 46 | 31 | |
| Nonvessel casualties | 420 | 281 | 101 | 137 | 76 | |
| Recreational boating | 1,418 | 1,360 | 865 | 829 | 813 | |
| Gas and hazardous | ||||||
| liquid pipeline | 30 | 19 | 9 | 21 | 18 | |
a Includes occupants, nonoccupants, and motor vehicle fatalities at railroad crossings.
b Includes fatalities from nontrain incidents, as well as train incidents and accidents. Also includes train occupants and nonoccupants, except motor vehicle occupants at grade crossings.
c Fatalities resulting from all reportable incidents, no just accidents. Includes commuter rail, heavy rail, light rail, motor bus, demand responsive, van pool, and automated guideway.
Key: N = data do not exist or are not cited because of reporting changes; P = preliminary; U = unavailable.
Source: U.S. Department of Transportation, Bureau of Transportation Statistics, Transportation Statistics Annual Report 1999, BTS99-03 (Washington, DC: 1999), table 4-1.
No other mode of transportation comes close to the automobile as a cause of death and injury.
Injuries by Transportation Mode
| Mode | 1970 | 1980 | 1990 | 1995 | 1998 | |
|---|---|---|---|---|---|---|
| Air carriera | 107 | 19 | R29 | 25 | 28 | |
| Commuter carriera | N | 14 | 11 | 25 | 2 | |
| On-demand air taxia | N | 43 | 36 | 14 | 11 | |
| General aviationa | 715 | R681 | R402 | 395 | 332 | |
| Highwayb | N | N | 3,231,000 | 3,465,000 | 3,192,000 | |
| Railroadc | 17,934 | 58,696 | 22,736 | 12,546 | 10,156 | |
| Transitd | N | N | 54,556 | 57,196 | U | |
| Waterborne | ||||||
| Vessel casualties | 105 | 180 | 175 | 145 | 83 | |
| Nonvessel casualties | U | U | U | 1,916 | 357 | |
| Recreational boating | 780 | 2,650 | 3,822 | 4,141 | 4,613 | |
| Gas and liquid pipeline | 254 | 192 | 76 | 64 | 75 | |
a Injuries classified as serious. See glossary.
b Includes passenger car occupants, motorcyclists, light-duty and large trucks, bus occupants, pedestrians, pedalcyclists, occupants of unknown vehicle types, and other nonmotorists..
c Injuries resulting from train accidents, train and nontrain incidents, and occupational illness. Includes Amtrak.
d Injuries resulting from all reportable incidents, not just from accidents. Includes commuter rail, heavy rail, light rail, motor bus, demand responsive, van pool, and automated guideway.
Key: N = data do not exist; P = preliminary; R = revised; U = unavailable.
Source: U.S. Department of Transportation, Bureau of Transportation Statistics, National Transportation Statistics 1999, (Washington, DC: 1999), table 4-1.
In driving it does not take two to tangle. About half of fatal accidents involve only one vehicle.
Total Fatalities in Traffic Crashes: 1998
| Drivers/occupants killed in single-vehicle crashes | 15,724 | |
| Pedestrians killed in single-vehicle crashes | 4,795 | |
| Pedalcyclists killed in single-vehicle crashes | 737 | |
| Subtotal | 21,256 | |
| Drivers/occupants killed in 2-vehicle crashes | 16,671 | |
| Drivers/occupants killed in more than two-vehicle crashes | 2,964 | |
| Pedestrians/pedalcyclists killed in multiple-vehicle crashes | 449 | |
| Others/unknown | 131 | |
| Total fatalities | 41,471 | |
Sources: U.S. Department of Transportation, National Highway Traffic Safety Administration, Fatality Analysis Reporting Systems Database; USDOT, NHTSA, Traffic Safety Facts 1998 (Washington, DC: October 1999).
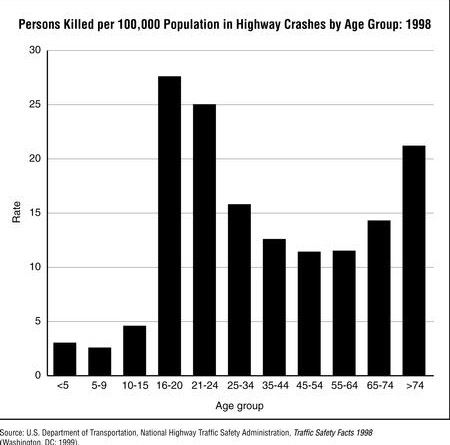
The rate of fatalities among elderly drivers is high not because they are in more accidents but because they are more likely to be killed or seriously injured when they are in an accident.
Although driving is becoming safer per mile travelled in the United States, it can be extremely dangerous in developing countries. With the rapid growth of automobile travel in these countries, we can expect a dramatic increase in the global total of highway deaths.
Various rates for a number of countries
| Country | Vehicles per 1000 people |
Deaths per 1000 people |
Deaths per million pop. |
Deaths per year |
Data year |
|---|---|---|---|---|---|
| USA | 777 | 0.21 | 158 | 41,907 | 1996 |
| Australia | 566 | 0.18 | 99 | 1,742 | 1992 |
| France | 522 | 0.28 | 145 | 8,412 | 1995 |
| Japan | 520 | 0.16 | 85 | 10,649 | 1994 |
| Great Britain | 478 | 0.13 | 62 | 3,621 | 1995 |
| Sweden | 450 | 0.13 | 61 | 537 | 1996 |
| Portugal | 448 | 0.47 | 221 | 2,100 | 1996 |
| Spain | 441 | 0.33 | 147 | 5,751 | 1995 |
| Ireland | 327 | 0.37 | 122 | 431 | 1993 |
| Israel | 257 | 0.39 | 101 | 550 | 1995 |
| Saudi Arabia | 138 | 1.63 | 224 | 4,077 | 1994 |
| Turkey | 111 | 0.75 | 84 | 5,347 | 1996 |
| Brazil | 89 | 1.89 | 169 | 25,000 | 1991 |
| Thailand | 48 | 5.33 | 255 | 15,176 | 1994 |
| Morocco | 43 | 2.99 | 129 | 3,359 | 1993 |
| Algeria | 33 | 4.23 | 140 | 3,678 | 1993 |
| India | 25 | 2.75 | 67 | 59,300 | 1993 |
| China | 19 | 2.72 | 53 | 63,508 | 1993 |
| Kenya | 15 | 7.13 | 108 | 2,516 | 1993 |
| Lesotho | 13 | 13.74 | 172 | 326 | 1993 |
| Ethiopia | 1 | 17.20 | 23 | 1,169 | 1990 |
Source: Evans, Leonard, Transportation Safety. In Handbook of Transportation Science, R.W. Hall Editor, Kluwer Academic Publishers, Norwell, MA, 1999. pp. 63-108.