Changing paths, changing demographics for academics
The decade of the 1990s has seen considerable change in the career patterns for new doctorates in science and engineering. It was once common for new doctorates to move directly from their graduate studies into tenure track appointments in academic institutions. Now it is more likely that they will find employment in other sectors or have nonfaculty research positions. This change has created a great deal of uncertainty in career plans and may be the reason for recent decreases in the number of doctorates awarded in many science and engineering fields.
Another change is that the scientific and engineering workforce is growing more diverse in gender, race, and ethnicity. Throughout the 1970s and 1980s, men dominated the science and engineering workplace, but substantial increases in the number of female doctorates in the 1990s has changed the proportions. Underrepresented minorities have also increased their participation but not to the same extent as have female scientists and engineers.

The narrowing tenure track
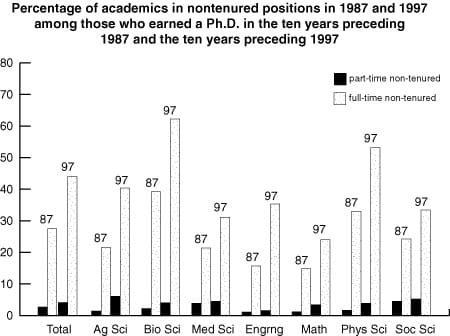
The most dramatic growth across all the employment categories has been in nonfaculty research positions. The accompanying graph documents the growth in such positions between 1987 and 1997. The 1987 data reflects the percentage of academic employees who earned a doctorate from 1977 to 1987 who were employed in nontenured positions in 1987. The 1997 data reflects the percentages for those who earned doctorates between 1987 and 1997. In many fields the percentage of such appointment almost doubled between 1987 and 1997.
Source: National Science Foundation, 1987 and 1997 Survey of Doctorate Recipients.

A rapidly growing role for women
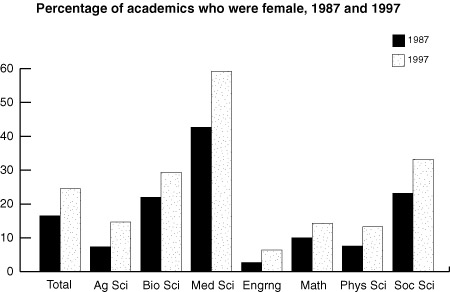
Between 1987 and 1997, the number of women in the academic workforce increased substantially in the fields in which they had the highest representation–biological sciences, medical sciences, and the social and behavioral sciences. The rate of increase for women was even faster in the fields in which they are least represented–agricultural sciences, engineering, mathematics, and physical sciences. Still, women are underrepresented in almost all scientific and technical fields.
Source: National Science Foundation, 1987 and 1997 Survey of Doctorate Recipients.

Slow growth in minority participation
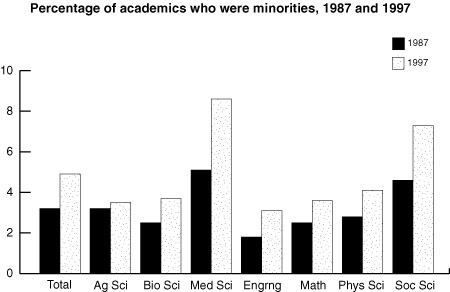
Minority participation also expanded during the period but at a slower rate than for women. African Americans, hispanics and native Americans comprise about 15 percent of the working population but only about 5 percent of the scientists and engineers working in universities. The data also shows substantial increases in the proportion of underrepresented minorities, but they are still not represented at a rate commensurate with their share of the population.
Source: National Science Foundation, 1987 and 1997 Survey of Doctorate Recipients.
