Asian Women in STEM Careers: An Invisible Minority in a Double Bind
Asian Women in STEM Careers: An Invisible Minority in a Double Bind
In the effort to increase the participation of women and people of color in science, technology, engineering, and math (STEM) careers, a common assumption is that Asian men and women are doing fine, that they are well represented in STEM and have no difficulty excelling in STEM careers. This belief is supported by the easy visibility of Asian faces on campuses, in STEM workplaces, and in government laboratories. Indeed, Asians are generally considered to be overrepresented. Data from the 2009 Survey of Earned Doctorates from U.S. universities show that 22% of the 2009 doctoral recipients planning to work in the United States were individuals of Asian descent. With so many entering the workforce, it is easy to assume that Asians women are progressing nicely and that they can be found at the highest levels of STEM industry, academics, and government institutions. The data tell a different story.
The advancement of Asian female scientists and engineers in STEM careers lags behind not only men but also white women and women of other underrepresented groups. Very small numbers of Asian women scientists and engineers are advancing to become full professors or deans or university presidents in academia, to serve on corporate board of trustees or become managers in industry, or to reach managerial positions in government. Instead, in academia 80% of this population can be found in non-faculty positions, such as postdocs, researchers, and lab assistants, or nontenured faculty positions, and 95% employed in industry and over 70% employed in government are in nonmanagerial positions. In earning power they lag behind their male counterparts as well as behind women of other races/ethnicities in STEM careers.
The challenges faced by women of color in STEM fields were clearly articulated 35 years ago when the term double bind was first used in reference to challenges unique to the intersection of gender and race/ethnicity that are faced by women of color in STEM fields. At the time these challenges were, and still are, commonly thought to apply less to Asian women than to black, Latina, and Native American women.
This data presented here point to the existence of a double bind for Asian women, facing both a bamboo ceiling because of Asian stereotyping and a glass ceiling because of implicit gender bias. The scarcity of Asian women in upper management and leadership positions merits greater attention, more targeted programmatic efforts, and inclusion in the national discussion of the STEM workforce.
Academic faculty
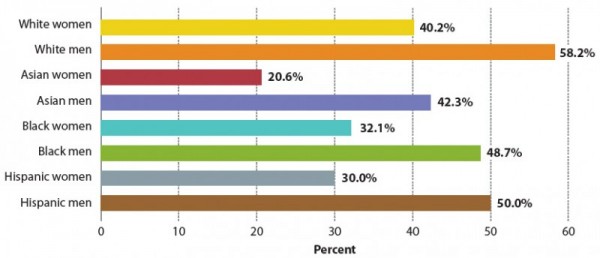
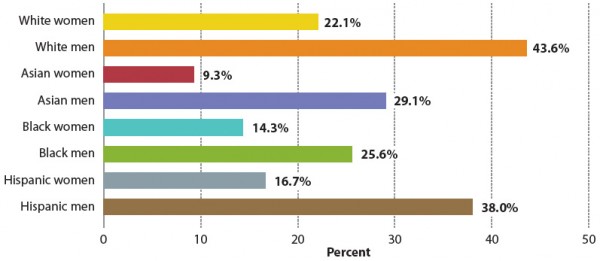
The percentage of Asian women employed by colleges and universities who are tenured or who are full professors is the smallest of any race/ethnicity and gender.
Percentage of doctoral scientists and engineers employed in universities and 4-year colleges (S&E occupations) who are tenured, by race/ethnicity and gender (2008)
Source. National Science Foundation, Division of Science Resources Statistics, Survey of Doctorate Recipients: 2008. Table 9-26 “Employed doctoral scientists and engineers in 4-year educational institutions, by broad occupation, sex, race/ethnicity, and tenure status: 2008” Accessed July 16, 2011
Note: Data of American Indian/Alaska Native and Native Hawaiian/Other Pacific Islander is suppressed for data confidentiality reasons.
Percentage of doctoral scientists and engineers employed in universities and 4-year colleges (S&E occupations) who are full professors, by race/ethnicity and sex (2008)
Source. National Science Foundation, Division of Science Resources Statistics, Survey of Doctorate Recipients: 2008. Table 9-25 “Employed doctoral scientists and engineers in 4-year educational institutions, by broad occupation, sex, race/ethnicity, and faculty rank: 2008” Accessed July 16, 2011
Note: Data of American Indian/Alaska Native and Native Hawaiian/Other Pacific Islander is suppressed for data confidentiality reasons.
Academic leadership
A 2006-7 survey of 2,148 presidents of two-year and four-year public and private colleges published by the American Council on Education (“The Spectrum Initiative: Advancing Diversity in the College Presidency”) found that only 0.9% of all college presidents were Asian. By comparison, 5.8% were black and 4.6% were Hispanic.
Asians holding science and engineering (S&E) doctorates comprise 34% of postdocs but only 7% of deans and department chairs. A similar bamboo ceiling for being Asian emerges in Table 2 when the data are disaggregated by academic rank; the higher the rank the smaller the percentage of Asians in the position. And we find the largest proportion of Asians fall in the “rank not available” group which includes mostly post-docs but also non-faculty researchers and staff or administrators who do not have a faculty rank.
Percentage S&E doctorate holders employed in universities and 4-year colleges who are Asian, by type of academic position (2008)
| Academic Position | Total employees | Non-Asians | Asians | percentage Asian |
|---|---|---|---|---|
| Post doc | 18,500 | 12,200 | 6,300 | 34.1% |
| Teaching Faculty | 179,600 | 157,700 | 21,900 | 12.2% |
| Research Faculty | 115,200 | 96,900 | 18,300 | 15.9% |
| Dean, Department head, Chair | 28,700 | 26,700 | 2,000 | 7.0% |
| President, Provost, Chancellor | 3,300 | Over 3,200** | D* | N/A |
Source. National Science Foundation. Women, Minorities, and Persons with Disabilities in Science and Engineering. Table 9-22 “S&E doctorate holders employed in universities and 4-year colleges, by type of academic position, sex, race/ethnicity, and disability status: 2008” Accessed July 16, 2011.
Notes: * Refers to data suppressed for data confidentiality reasons. **Includes 2,900 White, 200 Black, and 100 Hispanic.
The same pattern is found among Asian females. For Asians in S&E occupations, the percentage of females steadily decreases from 35% of assistant professors to 28% of associate professors to 12% of full professors. Furthermore, at each of these professorial ranks, the percentage of females in the Asian population is consistently lower than the percentage of females in the non-Asian population. (This is true for all occupations and S&E occupations.)
S&E doctoral holders employed in universities and 4-year colleges, by broad occupation, sex, and rank, for Asians and non-Asians (2008)
| S&E Occupations | Total | Total Asians | Asians: Female /Total |
Total Non-Asians |
Non-Asians: Female /Total |
|---|---|---|---|---|---|
| Total | 210,700 | 32,400 | 29.9% | 178,300 | 31.1% |
| Rank Not Available | 38,200 | 9,800 | 39.8% | 28,400 | 39.1% |
| Other Faculty | 10,400 | 1,300 | 46.2% | 9,100 | 45.1% |
| Assistant Professor | 44,000 | 8,100 | 34.6% | 35,900 | 40.4% |
| Associate Professor | 46,200 | 5,800 | 27.6% | 40,400 | 34.4% |
| Professor | 71,800 | 7,500 | 12.0% | 64,300 | 18.4% |
Source. National Science Foundation. Women, Minorities, and Persons with Disabilities in Science and Engineering. Table 9-25 “S&E doctorate holders employed in universities and 4-year colleges, by broad occupation, sex, race/ethnicity, and faculty rank: 2008”. Accessed July 16, 2011.
Government
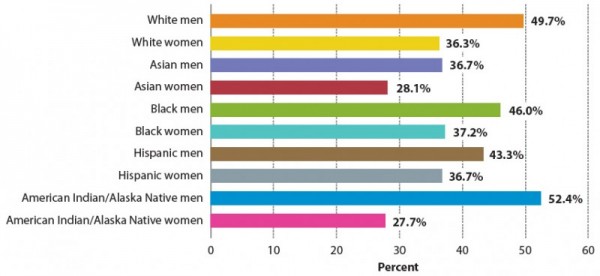
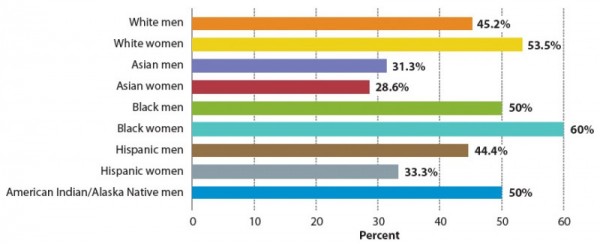
Disaggregating NSF government workforce data by gender and race/ethnicity reveals that the same pattern of under-representation of Asian women in management positions. American Indian/Alaska Native women are less well represented in management.
Percentage of scientists and engineers employed in government who are managers, by race/ethnicity and sex (2006)
Source. National Science Foundation. Women, Minorities, and Persons with Disabilities in Science and Engineering. Table H 32, with additional detailed data provided by Joan Burrelli, “Scientists and engineers employed in government, by managerial status, age, sex, race/ethnicity, and disability status: 2006.” . Accessed December 5, 2009.
Percentage of scientists and engineers holding doctorate degrees employed in government who are managers, by race/ethnicity and sex (2006)
Source. National Science Foundation. Women, Minorities, and Persons with Disabilities in Science and Engineering. Table H 32, with additional detailed data provided by Joan Burrelli, “Scientists and engineers employed in government, by managerial status, age, sex, race/ethnicity, and disability status: 2006.” . Accessed December 5, 2009.
Note: Data for Alaska Natives/Anerican Indian women are not available
Industry
According to the 2003 report Advancing Asian Women in the Workplace by Catalyst, a nonprofit research and advisory organization working to advance women in business and the professions, Asian-American women in industry are most likely to have graduate education but least likely to hold a position within three levels of the CEO. Among the more than 10,000 corporate officers in Fortune 500 companies, there were about 1,600 women of whom 30 were Asian.
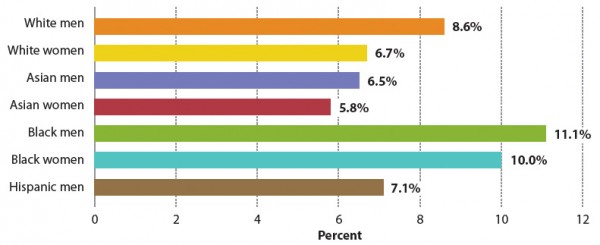
This trend has been borne out for scientists and engineers employed in industry and business as well. Disaggregating NSF industry workforce data by gender and race/ethnicity, we see that the percentage of Asian women scientists and engineers, including those with PhDs, who are S&E managers is the smallest of any race/ethnicity and gender.
Percentage of scientists and engineers employed in business or industry who are S&E managers, by race/ethnicity and gender (2006)
Source. National Science Foundation. Women, Minorities, and Persons with Disabilities in Science and Engineering. Table H 34. “Scientists and engineers employed in business or industry, by managerial occupation, sex, race/ethnicity, and disability status: 2006.” . Accessed Feburary 13, 2010. Note. Data for Alaska Natives/American Indians women are not available
Percentage of scientists and engineers doctorate degree holders employed in business or industry who are S&E managers, by race/ethnicity and sex (2006)
Source. National Science Foundation. Women, Minorities, and Persons with Disabilities in Science and Engineering. Table H 34 ,with additional detailed data provided by Joan Burrelli, “Scientists and engineers employed in business or industry, by managerial occupation, sex, race/ethnicity, and disability status: 2006.” . Accessed Feburary 13, 2010. Note. Data for Hispanic women, Alaska Natives/American Indians are not available
Industry leadership
The Leadership Education for Asian Pacifics, Inc. (LEAP) reported that in 2010 among the Fortune 500 companies there were only ten Asians, of whom three were women, with the position of chair, president, or CEO; of the 5,250 board members, only 2.08% were Asians or Pacific Islanders; and 80.4% of the companies hade no Asian and Pacific Islander board members.
A review of NSF data on the science and engineering business and industry workforce reveals a surprising under-representation of Asians at the managerial level. Only 6% of Asian scientists and engineers are managers, and only 2% are S&E managers. Again, the Asians are outpaced by all other ethnic/racial.
For the Asian scientists and engineers employed in industry, although women comprise 37% of the non-managers in this group, they are only 23% of the managers and 16% of the S&E managers. As in the other sectors, among all scientists and engineers who are employed in industry at the manager rank, the percentage of Asian females is consistently lower than the percentage of black and Hispanic females.
Scientists and engineers employed in business or industry, by managerial status, sex, and race/ethnicity (2006)
| All scientists and engineers | Non-managers | Managers | S&E managers | |||
|---|---|---|---|---|---|---|
| Total | Female/Total | Total | Female/Total | Total | Female/Total | |
| Total | 9,024,000 | 35.60% | 954,000 | 19.00% | 241,000 | 21.60% |
| White | 6,780,000 | 34.50% | 790,000 | 17.60% | 191,000 | 20.90% |
| Asian | 1,179,000 | 36.60% | 77,000 | 23.40% | 25,000 | 16.00% |
| Black | 407,000 | 47.70% | 33,000 | 42.40% | 11,000 | 45.50% |
| Hispanic | 467,000 | 38.10% | 38,000 | 23.70% | 11,000 | 18.20% |
| American Indian / Alaska Natives | 26,000 | 42.30% | 3000 | N/A | 1,000 | N/A |
Source. National Science Foundation. Women, Minorities, and Persons with Disabilities in Science and Engineering. Table H 34 ,with additional detailed data provided by Joan Burrelli, “Scientists and engineers employed in business or industry, by managerial occupation, sex, race/ethnicity, and disability status: 2006.” . Accessed Feburary 13, 2010.
Note. D = Suppressed for data confidentiality reasons; *= estimate less than 100

