Reversing the Incredible Shrinking Energy R&D Budget
The federal government and private industry are both reducing their investments in energy research and development (R&D) at a time when geopolitics, environmental concerns, and economic competitiveness call instead for a major expansion in U.S. capacity to innovate in this sector. Although the Bush administration lists energy research as a “highpriority national need” and points to the recently passed energy bill as evidence of action, the 2005 federal budget reduced energy R&D by 11 percent from 2004. The American Association for the Advancement of Science projects a decline in federal energy R&D of 18 percent by 2009. Meanwhile, and arguably most troubling, the lack of vision on energy is damaging the business environment for existing and startup energy companies. Investments in energy R&D by U.S. companies fell by 50 percent between 1991 and 2003.
This decline occurred despite numerous calls from expert groups for major new commitments to energy R&D. A 1997 report from the President’s Committee of Advisors on Science and Technology and a 2004 report from the bipartisan National Commission on Energy Policy each recommended that federal R&D spending be doubled. The importance of energy has led several groups to call for much larger commitments, on the scale of the Manhattan Project of the 1940s.
A comparison with the pharmaceutical industry is revealing. In the early 1980s, energy companies were investing more in R&D than were drug companies; today, drug companies invest 10 times as much in R&D as do energy firms. Total private sector energy R&D is less than the R&D budgets of individual biotech companies such as Amgen and Genentech. The nation’s ability to respond to the challenge of climate change and to the economic consequences of disruptions in energy supply has been significantly weakened by the lack of attention to long-term energy planning. The current energy bill is a collection of subsidies without any such vision.
Comparison to previous major government research programs suggests that a serious federal commitment to energy R&D could yield dramatic results. Using emissions scenarios from the Intergovernmental Panel on Climate Change and a framework for estimating the climate-related savings from energy R&D programs developed by Robert Schock from Lawrence Livermore National Laboratory, we calculate that energy R&D spending of $15-30 billion/year would be sufficient to stabilize CO2 at double pre-industrial levels. This 5- to 10-fold increase in spending from current levels is not a pie-in-the-sky proposal; in fact it is consistent with the growth seen in several previous federal programs, each of which took place in response to clearly articulated national needs. In the private sector, U.S. energy companies could increase their R&D spending by a factor of 10 and would still be below the average R&D intensity of U.S. industry. Past experience indicates that this investment would be repaid several times over in technological innovations, business opportunities, and job growth.
R&D investment is an essential component of a broad innovation-based energy strategy that includes transforming markets and reducing barriers to the commercialization and diffusion of nascent low-carbon energy technologies. The economic benefit of such a bold move would repay the country in job creation and global economic leadership, building a vibrant, environmentally sustainable engine of new economic growth.
Precedents for federal investment
For each of eight federal programs in which annual spending either doubled or increased by more than $10 billion during its lifetime, we calculate a baseline level of spending that would have occurred if funding grew 4.3 percent per year (the 50-year average historical growth rate of U.S. R&D). The difference between the actual spending and the baseline during the program we call extra program spending. We also examined the thesis that these large programs crowd out other research and found that the evidence for this contention is weak or nonexistent. In fact, large government R&D initiatives were associated with higher levels of both private sector R&D and R&D in other federal programs.
| PEAK YEAR (2002$ Billions) |
PROGRAM DURATION (2002$ Billions) |
||||||
|---|---|---|---|---|---|---|---|
| Program | Sector | Years | Spending | Increase | Spending | Extra Spending | Factor Increase |
| Manhattan Project | Defence | 1940-45 | $10.0 | $10.0 | $25.0 | $25.0 | n/a |
| Apollo Program | Space | 1963-72 | $23.8 | $19.8 | $184.6 | $127.4 | 3.2 |
| Project Independence | Energy | 1975-82 | $7.8 | $5.3 | $49.9 | $25.6 | 2.1 |
| Reagan defence | Defence | 1981-89 | $58.4 | $27.6 | $445.1 | $100.3 | 1.3 |
| Doubling NIH | Health | 1999-04 | $28.4 | $13.3 | $138.3 | $32.6 | 1.3 |
| War on Terror | Defence | 2002-04 | $67.7 | $19.5 | $187.1 | $29.6 | 1.2 |
| 5x energy scenario | Energy | 2005-15 | $17.1 | $13.7 | $96.8 | $47.9 | 2.0 |
| 10x energy scenario | Energy | 2005-15 | $34.0 | $30.6 | $154.3 | $105.4 | 3.2 |
Source: (National Science Foundation, Division of Science Resources Statistics, 2004).
Declining energy R&D investment
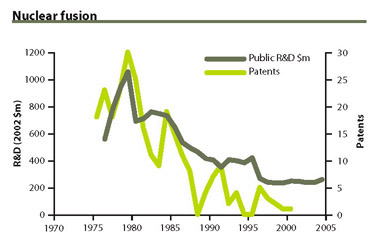
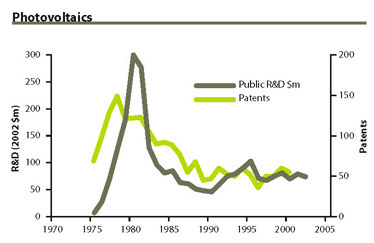
Since 1980, energy R&D as a percentage of total U.S. R&D has fallen from 10 percent to 2 percent. Since the mid-1990s, both public and private sector R&D spending has been stagnant for renewable energy and energy efficiency, and has declined for fossil fuel and nuclear technology. The lack of industry investment suggests that the public sector needs to play a role in not only increasing investment directly but also correcting the market and regulatory obstacles that inhibit investment in new technology.
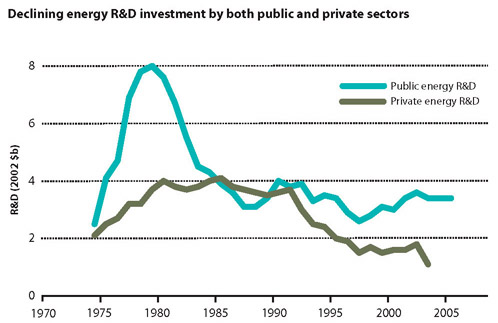
Sources: R. M. Wolfe, “Research and Development in Industry” (National Science Foundation, Division of Science Resources Statistics, 2004); M. Jefferson, et al., “Energy Technologies for the 21st Century” (World Energy Council, 2001); R. L. Meeks, “Federal R&D Funding by Budget Function: Fiscal Years 2003-05” NSF 05-303 (National Science Foundation, Division of Science Resources Statistics, 20040; R. Margolis, and D. M. Kammen “Underinvestment: The energy technology and R&D policy challenge”, Science, 285, 690-692 (1999).
Patent data confirms problem
Patenting provides a measure of the outcomes of the innovation process. We use records of successful U.S. patent applications as a proxy for the intensity of innovative activity and find strong correlations between public R&D and patenting across a variety of energy technologies. Since the early 1980s, all three indicators—public sector R&D, private sector R&D, and patenting—exhibit consistently negative trends. The data include only U.S. patents issued to U.S. inventors. Patents are dated by their year of application to remove the effects of the lag between application and approval.
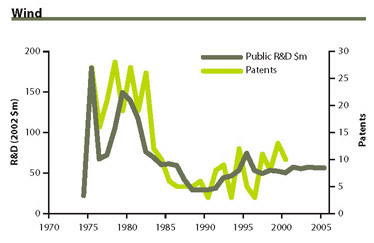
Source: U.S. Patent and Trademark Office patent database.
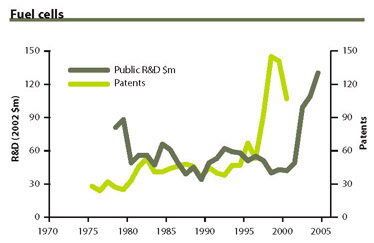
Source: U.S. Patent and Trademark Office patent database.
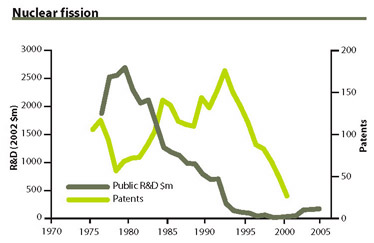
Source: U.S. Patent and Trademark Office patent database.
Source: U.S. Patent and Trademark Office patent database.
Source: U.S. Patent and Trademark Office patent database.
Highly cited patents offer hope
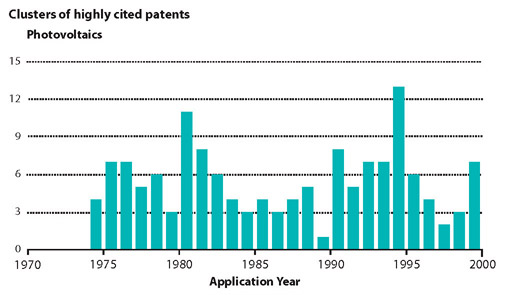
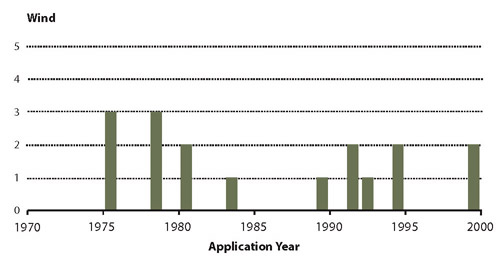
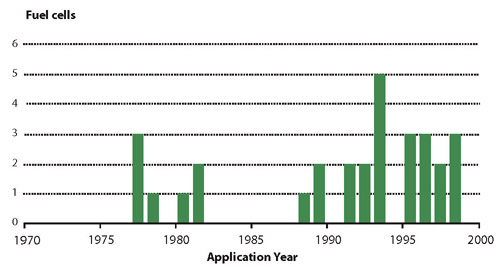
In the same way that journal citations can be used as a measure of scientific importance, patent citation data can be used to identify “high-value” patents. In the energy sector, valuable patents do not occur randomly; they cluster in specific periods of productive innovation. In each year, between 5 percent and 10 percent of the patents examined qualified as high value. The drivers behind these clusters of valuable patents include R&D investment, growth in demand, and exploitation of technical opportunities. These clusters reflect both successful innovations and productive public policies, and mark opportunities to further energize emerging technologies and industries.
Source: B. H. Hall, A. B. Jaffe, M. Trajtenberg, “The NBER Patent Citation Data File: Lessons, Insights and Methodological Tools.” (NBER, 2001).
Source: B. H. Hall, A. B. Jaffe, M. Trajtenberg, “The NBER Patent Citation Data File: Lessons, Insights and Methodological Tools.” (NBER, 2001).
Source: B. H. Hall, A. B. Jaffe, M. Trajtenberg, “The NBER Patent Citation Data File: Lessons, Insights and Methodological Tools.” (NBER, 2001).
The fuel cell exception
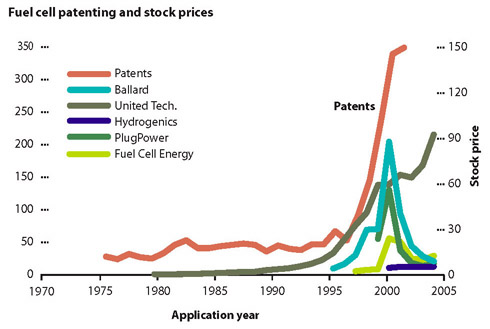
One bright spot in the nation’s energy innovation system is the increased investment and innovation in fuel cells. Despite a 17 percent drop in federal funding, patenting activity intensified by nearly an order of magnitude, from 47 in 1994 to 349 in 2001, with much of the activity driven by private sector investment fuelled by rising stock prices. The relationship between fuel cell company stock prices and patenting is stronger than that between patenting and public R&D. The five firms shown account for 24 percent of patents from 1999 to 2004. Almost 300 firms received fuel cell patents between 1999-2004, reflecting participation both by small and large firms.
Source: U.S. Patent and Trademark Office patent database.
Federal energy patents seldom cited
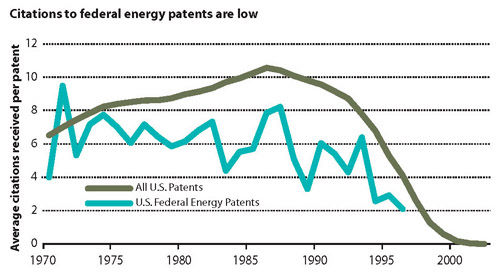
Patent citations can be used to measure both the return on R&D investment and the health of the technology commercialization process, as patents from government research provide the basis for subsequent patents related to technology development and marketable products. The difference between the U.S. federal energy patent portfolio and all other U.S. patents is striking, with energy patents earning on average only 68 percent as many citations as the overall U.S. average from 1970 to 1997. This lack of development of government-sponsored inventions should not be surprising given the declining emphasis on innovation among private energy companies.
Sources: B. H. Hall, A. B. Jaffe, M. Trajtenberg, “The NBER Patent Citation Data File: Lessons, Insights and Methodological Tools.” (NBER, 2001); G. Nemet and D. M. Kammen, (2005) Energy Policy, submitted.
