When Children Die
The death of a child is a special sorrow, an enduring loss for surviving mothers, fathers, brothers, sisters, other family members, and close friends. No matter the circumstances, a child’s death is a life-altering experience. In 1999, approximately 55,000 children ages 0 to 19 died in the United States.
Fortunately, in the United States and other developed countries, death in childhood is no longer common. Many infants who once would have died from prematurity, complications of childbirth, and congenital anomalies (birth defects) now survive. Likewise, children who would have perished in the past from an array of childhood infections today live healthy and long lives, thanks to sanitation improvements, vaccines, and antibiotics.
In the course of a century, the proportion of all deaths in the United States occurring in children under age 5 dropped from 30 percent in 1900 to just 1.4 percent in 1999. Infant mortality dropped from approximately 100 deaths per 1,000 live births in 1915 to 7.1 per 1,000 in 1999.
Because adults account for most deaths in the United States, programs of palliative and end-of-life care understandably focus on adults, especially older adults who account for over 70 percent of deaths each year. Health care professionals and others are, however, increasingly responding to the special needs of gravely ill or injured children and their families, including palliative and end-of-life care that reflects differences in the major causes of death. A comprehensive study of this issue can be found in the Institute of Medicine report When Children Die: Improving Palliative and End-of-Life Care for Children and their Families
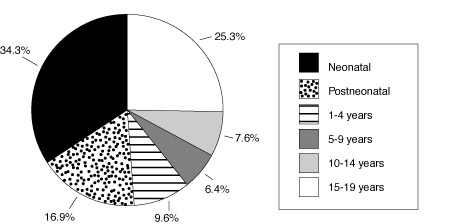
Greatest risk at birth
About half of all child deaths occur during infancy, and most of these deaths occur soon after birth.
Accidents become important later
Reflecting the concentration of child deaths among infants, an array of newborn and infant conditions are among the leading causes of child mortality. Another large fraction of child deaths–about 30 percent–is accounted for by unintentional and intentional injuries.
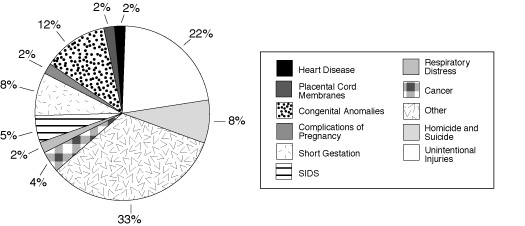
Causes of death differ with age
Patterns of child mortality differ considerably from patterns for adults, especially elderly adults who die primarily from chronic conditions such as heart disease and cancer. Among newborns, most deaths are due to congenital abnormalities or complications associated with prematurity, pregnancy, or childbirth. For older infants, sudden infant death syndrome (SIDS) is an important cause of death. Fatal injuries dominate among children and adolescents.
Numbers of Deaths by Cause and Age Group (1999)
| Age Group (years) | |||
|---|---|---|---|
| Infant (<1) | 1-4 | 5-14 | 15-24 |
| Congenital anomalies | Accidents | Accidents | Accidents |
| 5,473 | 1,898 | 3,091 | 13,656 |
| Short gestation and low birth weight | Congenital anomalies | Malignant neoplasms | Homicide |
| 4,392 | 549 | 1,012 | 4,998 |
| SIDS | Malignant neoplasms | Homicide | Suicide |
| 2,648 | 418 | 432 | 3,901 |
| Complications of pregnancy | Homicide | Congenital anomalies | Malignant neoplasms |
| 1,399 | 376 | 428 | 1,724 |
| Respiratory distress syndrome | Diseases of the heart | Diseases of the heart | Diseases of the heart |
| 1,110 | 183 | 277 | 1,069 |
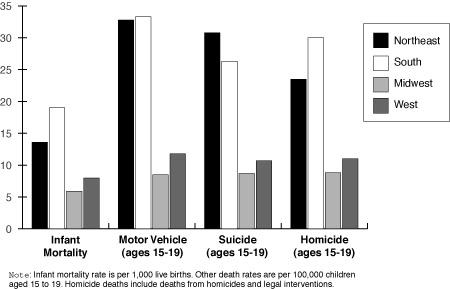
Regional differences
Reflecting social, economic, physical, and other differences, states and regions show considerable variation in child mortality by cause. Variation at the state level is more dramatic. In 1999, the District of Colombia had the highest infant mortality rate (15.0 per 1,000 live births), followed by South Carolina (10.2 per 1,000 live births). Maine and Utah had the lowest rate at 4.8 deaths per 1,000 live births. In the same year, for those aged 0 to 19, Wyoming led the nation in motor vehicle fatality rates (23.5 per 100,000), followed by Mississippi (20.9 per 100,000). The lowest fatality rates were for Hawaii (3.6 per 100,000) and Rhode Island (3.8 per 100,000). Juvenile homicide rates also differ substantially among states. Maryland led the nation in 1999 with a homicide rate of 7.8 per 100,000, followed by Illinois at 7.25 per 100,000. Hawaii and Utah had the lowest rates at 0.6 and 0.75 per 100,000, respectively. Juvenile homicides are concentrated among males in impoverished areas of large urban counties.
Gender, race, and ethnicity also matter
Demographic variation is also significant. Across all age ranges and for most causes of deaths, boys have a higher death rate than girls. At all ages, the death rates for black children is higher than for white or Hispanic children.
Deaths Due to Injury Compared to Other Conditions, by Age and Race (1999)
| Age (years) |
Injury Rate per 100,000 (number) |
Other Conditions Rate per 100,000 (number) |
||||
|---|---|---|---|---|---|---|
| Black | White | Black/White Ratio |
Black | White | Black/White Ratio |
|
| 1-4 | 27.4 (609) | 13.4 (1,605) | 2.0 | 30.6 (693) | 16.1 (1,936) | 1.9 |
| 5-9 | 14.8 (465) | 7.2 (1,129) | 2.1 | 13.2 (418) | 8.2 (1,278) | 1.6 |
| 10-14 | 13.8 (426) | 10.7 (1,650) | 1.3 | 13.9 (416) | 9.1 (1,385) | 1.5 |
| 15-19 | 69.6 (2,119) | 51.2 (8,009) | 1.4 | 22.9 (692) | 13.9 (2,156) | 1.6 |
Source data for all tables and figures: National Center for Health Statistics