How to Fix Our Dam Problems

California is the world’s eighth largest economy and generates 13% of U.S. wealth. Yet Governor Arnold Schwarzenegger says high temperatures, low rainfall, and a growing population have created a water crisis there. A third of the state is in extreme drought and, if there’s another dry season, faces catastrophe. The governor fears that his economy could collapse without a $5.9 billion program to build more dams.

His concerns are widely shared in the United States—not to mention in dry Australia, Spain, China, and India. Yet as California desperately seeks new dam construction, it simultaneously leads the world in old dam destruction. It razes old dams for the same reasons it raises new dams: economic security, public safety, water storage efficiency, flood management, job creation, recreation, and adaptation to climate change. Dam-removal supporters include water districts, golf courses, energy suppliers, thirsty cities, engineers, farmers, and property owners.

With 1,253 dams risky enough to be regulated and 50 times that many unregistered small dams, California is a microcosm of the world. There are more than 2.5 million dams in the United States, 79,000 so large they require government monitoring. There are an estimated 800,000 substantial dams worldwide. But within the next two decades, 85% of U.S. dams will have outlived their average 50-year lifespan, putting lives, property, the environment, and the climate at risk unless they are repaired and upgraded.

Neither dam repair nor dam removal is a recent phenomenon. What is new is their scale and complexity as well as the number of zeros on the price tag. Between 1920 and 1956, in the Klamath River drainage 22 dams were dismantled at a total cost of $3,000. Today, the removal of four dams on that same river—for jobs, security, efficiency, safety, legal compliance, and growth—will cost upwards of $200 million.

Which old uneconomical dams should be improved or removed? Who pays the bill? The answers have usually come through politics. Pro-dam and anti-dam interests raise millions of dollars and press their representatives to set aside hundreds of millions more tax dollars to selectively subsidize pet dam projects. Other bills bail out private owners: A current House bill earmarks $40 million for repairs; another one sets aside $12 million for removals. The outcome is gridlock, lawsuits, debt spending, bloated infrastructure, rising risks, dying fisheries, and sick streams.

Dam decisions don’t have to work that way. Rather than trust well-intentioned legislators, understaffed state agencies, harried bureaucrats, or nonscientific federal judges to decide the fate of millions of unique river structures, there’s another approach. State and federal governments should firmly set in place safety and conservation standards, allow owners to make links between the costs and benefits of existing dams, and then let market transactions bring health, equity, and efficiency to U.S. watersheds. Social welfare, economic diversity, and ecological capital would all improve through a cap-and-trade system for water infrastructure. This system would allow mitigation and offsets from the vast stockpile of existing dams while improving the quality of, or doing away with the need for, new dam construction.

Big benefits, then bigger costs

A new dam rises when its public bondholder/taxpayer or private investor believes that its eventual benefits will outweigh immediate costs. When first built, dams usually fulfill those hopes, even if the types of benefits change over time. In early U.S. history, hundreds of dams turned water mills or allowed barge transport. Soon, thousands absorbed flood surges, diverted water for irrigation, or slaked the thirst of livestock. Later still, tens of thousands generated electrical power, stored drinking water for cities, and provided recreation. North America built 13% of its largest dams for flood control, 11% for irrigation, 10% for water supply, 11% for hydropower, 24% for some other single purpose such as recreation or navigation, and 30% for a mix of these purposes. Today, the primary reason is drinking water storage and, to a far lesser extent, hydropower and irrigation.

Unfortunately, we usually fail to heed all the indirect, delayed, and unexpected downstream costs of dams. With planners focused primarily on near-term benefits, during the past century three large dams, on average, were built in the world every day. Few independent analyses tallied exactly why those dams came about, how they performed, and whether people have been getting a fair return on their $2 trillion investment. Now that the lifecycle cost is becoming manifest, we are beginning to see previously hidden costs.

First, it turns out that a river is far more than a natural aqueduct. It is a dynamic continuum, a vibrant lifeline, a force of energy. Dams, by definition, abruptly stop it. But all dams fill with much more than water. They trap river silt or sediment at rates of between 0.5% and 1% of the dam’s storage capacity every year. Layer by layer, that sediment settles in permanently. By restraining sediment upstream, dams accelerate erosion below; hydrologists explain that dams starve a hungry current that then must scour and devour more soil from the river bed and banks downstream. Silt may be a relatively minor problem at high altitudes, but it plagues U.S. landscapes east of the Rockies, where precious topsoil is crumbling into rivers, backing up behind dams, and flowing out to sea. Removing trapped sediment can cost $3 per cubic meter or more, when it can be done at all.

NEITHER DAM REPAIR NOR DAM REMOVAL IS A RECENT PHENOMENON. WHAT IS NEW IS THEIR SCALE AND COMPLEXITY AS WELL AS THE NUMBER OF ZEROS ON THE PRICE TAG.

The second enemy is the sun. Whereas sediment devours reservoir storage from below, radiant heat hammers shallows from above. In dry seasons and depending on size, dam reservoirs and diversions can evaporate more water than they store. Rates vary from dam to dam and year to year, but on average evaporation annually consumes between 5% and 15% of Earth’s stored freshwater supplies. That’s faster than many cities can consume. It’s one of the reasons why the Rio Grande and Colorado Rivers no longer reach the sea and why precious alluvial groundwater is shrinking, too. Nine freshwater raindrops out of 10 fall into the ocean, so the trick is to see the entire watershed—from headwater forest to alluvial aquifers through downstream floodplain—as potentially efficient storage and tap into water locked beneath the surface. Today, irrigators pump more groundwater than surface water. In arid landscapes, water is more efficiently and securely stored in cool, clean alluvial aquifers than in hot, shallow, polluted reservoirs.

The third threat to dam performance, as both a cause and a consequence, is climate change. Dams are point-source polluters. Scientists have long warned that dams alter the chemistry and biology of rivers. They warm the water and lower its oxygen content, boosting invasive species and algae blooms while blocking and killing native aquatic life upstream and down. Rivers host more endangered species than any other ecosystem in the United States, and many of the nation’s native plants and animals, from charismatic Pacific salmon to lowly Southern freshwater mussels, face extinction almost entirely because of dams.

What we didn’t appreciate until recently is that dams also pollute the air. The public may commonly see dams as producers of clean energy in a time of dirty coal and escalating oil prices. Yet fewer than 2% of U.S. dams generate any power whatsoever. Some could be retrofitted with turbines, and perhaps various existing dams should be. But peer-reviewed scientific research has demonstrated that dams in fact may worsen climate change because of reservoir and gate releases of methane. Brazil’s National Institute for Space Research calculated that the world’s 52,000 large dams (typically 50 feet or higher) contribute more than 4% of the total warming impact of human activities. These dam reservoirs contribute 25% of human-caused methane emissions, the world’s largest single source. Earth’s millions of smaller dams compound that effect.

Worse, as climate change accelerates, U.S. dams will struggle to brace for predicted drought and deluge cycles on a scale undreamed of when the structures were built. This brings us to the fourth danger. Dams initially designed for flood control may actually make floods more destructive. First, they lure people to live with a false sense of security, yet closer to danger, in downstream floodplains. Then they reduce the capacity of upstream watersheds to absorb and control the sudden impact of extreme storms. Looking only at mild rainstorms in October 2005 and May 2006, three states reported 408 overtoppings, breaches, and damaged dams. Only half of the nation’s high-hazard dams even have emergency action plans.

The scariest aspect of dams’ liabilities is the seemingly willful ignorance in the United States of their long-term public safety risks. Engineers put a premium on safety, from design to construction through eventual commission. Yet after politicians cut the ceremonial ribbon, neglect creeps in. As dams age they exhibit cracks, rot, leaks, and in the worst cases, failure. In 2006, the Kaloko Dam on the Hawaiian island of Kauai collapsed, unleashing a 70-foot-high, 1.6-million-ton freshwater tsunami that carried trees, cars, houses, and people out to sea, drowning seven. This is not an isolated exception, but a harbinger.

These preventable tragedies happen because both public and private dams lack funds for upkeep and repair. In 2005, the American Society of Civil Engineers gave U.S. dams and water infrastructure a grade of D and estimated that nationwide, repairing nonfederal dams that threaten human life would cost $10.1 billion. The U.S. Association of State Dam Safety Officials (ASDSO) placed the cost of repairing all nonfederal dams at $36.2 billion. Yet Congress has failed to pass legislation authorizing even $25 million a year for five years to address these problems.

Cash-strapped states generally don’t even permit dam safety officials to perform their jobs adequately. Dozens of states have just one full-time employee per 500 to 1,200 dams. Hence state inspectors, like their dams, are set up to fail. Between 1872 and 2006, the ASDSO reports, dam failures killed 5,128 people.

As environmental, health, and safety regulations drive up the cost of compliance, owners of old dams tend to litigate or lobby against the rules. Others simply walk away. The number of abandoned or obsolete dams keeps rising: 11% of inventoried dams in the United States are classified under indeterminate ownership.

To date, warnings have been tepid, fitful, disregarded, or politicized. In 1997, the American Society of Civil Engineers produced good guidelines for the refurbishment or retirement of dams. They have been ignored. In 2000, the landmark World Commission on Dams established criteria and guidelines to address building, managing, and removing dams, but its report so challenged water bureaucrats that the World Bank, the commission’s benefactor, has tried to walk away from its own creation. Environmental organizations have published tool kits for improving or removing old dams, but activists often target only the most egregious or high-profile dozen or so problems that best advance their profile or fundraising needs.

Dams have always been politically charged and often the epitome of pork-barrel projects. For the same reasons, dam removal can get bipartisan support from leading Democrats and Republicans alike. The switch from the Clinton to Bush administrations led to attempted alterations of many natural resource policies, but one thing did not change: the accelerating rate of dam removals. In 1998, a dozen dams were terminated; in 2005, some 56 dams came down in 11 states. Yet despite bipartisan support, there has never been any specific dam policy in either administration. A dam’s demise just happened, willy-nilly, here and there. Dams died with less legal, regulatory, or policy rationale than accompanied their birth.

Thoreau had it right

No laws, no regulations, no policy? Federal restraint remains an alluring ideal in a nation that feels cluttered with restrictions. It’s a deeply ingrained American sentiment, embodied in Henry David Thoreau’s famous remark in Civil Disobedience: “That government is best which governs least.” Yet the founder of principled civil disobedience was also the first critic of seemingly benign dams because of their unintended effects.

While paddling with his brother on the Concord and Merrimack Rivers in 1839, Thoreau lamented the disappearance of formerly abundant salmon, shad, and alewives. Vanished. Why? Because “the dam, and afterward the canal at Billerica …put an end to their migrations hitherward.” His elegy reads like an Earth First! manifesto: “Poor shad! where is thy redress? …armed only with innocence and a just cause …I for one am with thee, and who knows what may avail a crowbar against that Billerica dam?”

Thoreau restrained himself from vigilante dam-busting, but 168 years later the effects of the country’s dams have only multiplied in number and size. Happily, the end of Thoreau’s tale might nudge us in the right direction. He did not complain to Washington or Boston for results, funds, or a regulatory crackdown. He looked upstream and down throughout the watershed and sought to build local consensus. Because the dam had not only killed the fishery but buried precious agricultural farmland and pasture, Thoreau advocated an emphatically civic-minded, consensus-based, collective, economically sensible proposal, in which “at length it would seem that the interests, not of the fishes only, but of the men of Wayland, of Sudbury, of Concord, demand the leveling of that dam.”

In other words, if those watershed interests were combined, they could sort out fixed liabilities from liquid assets. The economic beneficiaries of a flowing river, including the legally liable dam owner, should pay the costs of old dam removal, just as the beneficiaries of any new dam pay the costs of its economic, environmental, and security effects. In a few words, Thoreau sketched the outlines of what could emerge as a policy framework for existing dams that could be adapted to a river basin, a state, or a nation.

The most successful and least intrusive policies can be grouped under the strategic approach known as cap and trade. That is, the government sets a mandatory ceiling on effects, pollution, or emissions by a finite group of public and private property stakeholders. This ceiling is typically lower than present conditions. But rather than forcing individual stakeholders to comply with that target by regulatory fiat, each one can trade offsets, what amount to pollution credits, with each other. Those who cut waste, emissions, and effects better may sell their extra credits to laggards or newcomers. This approach leverages incentives to reform, innovate, and improve into a competitive advantage in which everyone benefits, and so does nature. Although it did not involve dams, a cap-and-trade policy was tested nationally under the 1990 Clean Air Act revisions aimed at cutting acid rain–causing sulfur dioxide emissions of U.S. factories in half. When it was announced, the utility industry gloomily predicted a clean-air recession, whereas environmentalists cried sellout over the lack of top-down regulatory controls. But cap and trade turned out to reduce emissions faster than the most optimistic projection. The industry grew strong and efficient, and the result was the largest human health gains of any federal policy in the 1990s. Annual benefits exceeded costs by 40:1.

Since then, cap-and-trade policies have proliferated from India to China to Europe. Though far from flawless, a cap-and-trade carbon policy is one success story to emerge from the troubled Kyoto Protocol to reduce emissions that accelerate climate change. Nations and multinational corporations such as General Electric and British Petroleum used it to reduce polluting emissions of carbon dioxide and methane while saving voters and shareholders money in the process. More recently, atmospheric cap and trade has been brought down to earth; the valuation and exchange in environmental offsets have been applied to land and water ecosystems. Certain states use cap and trade in policies to curb nitrogen oxides and nonpoint water pollution, others to reduce sediment loads and water temperature, and still others to trade in water rights when diversions are capped. California’s Habitat Conservation Plans work within the Endangered Species Act’s “cap” of preservation, yet allow “trade” of improving, restoring, and connecting habitat so that although individuals may die, the overall population recovers. Under the Clean Water Act, a cap-and-trade policy encourages mitigation banking and trading, which leads to a net gain in wetlands.

In each case the policy works because it lets democratic governments do what they do best—set and enforce a strict uniform rule—while letting property owners, managers, investors, and entrepreneurs do what they do best: find the most cost-effective ways to meet that standard. Given the documented risks of the vast stockpile of aging dam infrastructure in the United States, a cap-and-trade policy for dams could be tested to see if it can restore efficiency, health, and safety to the nation’s waters.

Making the policy work

The first step would be to inventory and define all the stakeholders. In air-quality cap-and-trade cases, these include factory owners, public utilities, manufacturers, refineries, and perhaps even registered car owners. In the case of dams, one could begin with the 79,000 registered owners in the National Inventory of Dams. Tracking down ownership of the estimated 2.5 million smaller unregistered dams may prove a bit challenging, until their owners realize that dismantling the dams can yield profit if removal credits can be bought and sold.

The second step would be to recognize the legitimate potential for trades. Dams yield (or once yielded) economic benefits, but every dam also has negative effects on air emissions and water quality, quantity, and temperature, therefore on human health and safety, economic growth, and stability. Even the most ardent dam supporter acknowledges that there is room for potentially significant gains in performance from dams as well as from the rivers in which they squat. Whereas the top-down goal in the past had been to subsidize or regulate new dams for their economic benefits, the aim in this case is horizontal: to encourage an exchange to reduce old dams’ economic and ecological costs.

Third, quantify the kind, extent, and nature of those negative effects. Our scientific tools have advanced considerably and are now ready to measure most if not all of those qualitative damages observed by amateurs since Thoreau. By breaking them down into formal “conservation units,” degrees Celsius, water quality, cubic meters of sediment, and so forth, we can quantify potential offsets in ecological and economic terms. The United States could set out rigorous scientific standards modeled on the Clean Air Act cap-and-trade policy or wetlands mitigation banking,

Fourth, start small, then replicate and scale up with what works best. The pilot exchanges could be structured by geography or by type of effect. But both kinds of pilot programs have already begun. One creative company in North Carolina, Restoration Systems, has begun to remove obsolete dams to gain wetlands mitigation credits that it can sell and trade, in most cases, to offset the destruction of nearby wetlands by highway building. In Maine, several dams in the Penobscot River watershed have been linked through mitigation as part of a relicensing settlement. On the Kennebec River, also in Maine, the destruction cost of the Edwards Dam was financed in large part by upstream industrial interests and more viable dams as part of a package for environmental compliance. On the west coast, the Bonneville Power Administration is using hydropower funds to pay for dam removals on tributaries within the Columbia River basin.

These early efforts are fine, but restricted geographically; each approach could be allowed to expand. The larger the pool of stakeholders, the greater are the economies of scale and the more efficient the result. But a national consensus and standards do not emerge overnight, nor should they, given that there are so many different dams. Each dam is unique in its history and specific in its effects, even though the cumulative extent and degree of those effects are statewide, national, and sometimes even global. A cap-and-trade policy will emerge nationally only as it builds on examples like these.

Finally, work within existing caps while using a standard that lets the amoral collective marketplace sort out good from bad. The beauty of this framework is that many of the national standards are already in place. Legal obligations to comply with the National Environmental Policy Act, Endangered Species Act, Clean Water Act, and Clean Air Act all have strong bearing on decisions to remove or improve dams. Some tweaking may be required, but perhaps not much. Recently, Congress revised the Magnuson-Stevens Act to pilot cap-and-trade policies in fishery management, in which fishermen trade shares of a total allowable or capped offshore catch of, say, halibut or red snapper.

Those overworked state and federal agencies responsible for enforcing laws—the ASDSO, the Army Corps of Engineers, the Fish and Wildlife Service, the National Marine Fisheries Services, and the Environmental Protection Agency— need not get bogged down in the thankless task of ensuring that each and every dam complies with each and every one of the laws. Dam owners may have better things to do than argue losing battles on several fronts with various government branches. All parties can better invest their time according to their mandate, strengths, and know-how: officials in setting the various standard legal caps and ensuring that they are strictly applied to the entire tributary, watershed, state, or nation; and dam owners in trading their way to the best overall result.

A cap-and-trade scenario

Suppose, for example, that a worried governor determines to cap at one-third below current levels all state dam effects: methane emissions, sedimentation rates, evaporative losses, aquatic species declines, habitat fragmentations, artificial warming, reduced oxygen content, and number of downstream safety hazards. He wants these reductions to happen within seven years and is rigorous in enforcing the ceiling. That’s the stick, but here’s the carrot: He would allow dam owners to decide how to get under that ceiling on their own.

At first, dam owners and operators, public as well as private, could reliably be expected to howl. They would label the policy environmentally extreme and say it was sacrificing water storage, energy, food, and flood control. But eventually, innovative dam owners and operators would see the policy for what it really is: a flexible and long-overdue opportunity with built-in incentives to become efficient and even to realize higher returns on existing idle capital. They would seize a chance to transform those fixed liabilities into liquid assets.

One likely effect would be private acquisition of some of the many thousands of small orphan dams. By liquidating these, an investor would accumulate a pool of offset credits that could be sold or traded to cumbersome dams with high value but low flexibility. This development has already emerged in isolated cases. In northern Wisconsin, the regional power company bought and removed two small, weak dams in exchange for a 25-year license to operate three healthier ones in the same watershed. Utilities in the West have taken notice and begun to package their relicensing strategies accordingly.

Another predictable outcome would be that, in order to retain wide popular and political support, big power, transport, and irrigation dam projects—think Shasta, Oroville, San Luis Reservoir, Glen Canyon, and Hoover—would mitigate their effects first by looking upstream at land and water users, then at other smaller dams that could be upgraded, retrofitted, or removed to gain efficiencies in ways easier or cheaper than they could get by overhauling their own operations and managements.

There would also be a likely expansion outward and upward in user fees raised from formerly invisible or subsidized beneficiaries from the services of existing dams. Such services range from recreational boaters, anglers, and bird hunters to urban consumers, lakefront property owners, and even those who merely enjoy the bucolic view of a farm dam. These disaggregated interests have largely supported dams, but only as long as others foot the bill for maintenance and upkeep. Economists call them free riders, and a new cap-and-trade dam policy would reduce their ranks. Dams that failed to generate enough revenues to meet national standards could earn credits by selling themselves to those interests that could. This happened when viable upstream industries on the Kennebec River helped finance the removal of Edwards Dam.

Another effect would be an innovation revolution in the kinds of tools and technologies that are already in the works but that have lacked a national incentive to really flourish. These include new kinds of fish passages, dredging techniques, low-flush toilets, and timed-drip irrigation, along with a more aggressive use of groundwater that pumps reservoir water underground as soon as it is trapped. The range of tools would also include financial instruments; in the West, they might accelerate the trading in water rights between agricultural, industrial, urban, and environmental users that has begun in Oregon, Montana, Washington, and California.

This brings us to a final advantage of a cap-and-trade policy for existing dams: global competitiveness. Seventy years ago, the United States set off a macho global race to build the biggest dams on Earth, starting with Hoover. It’s not clear which country won the top-down competition, which displaced 80 million people and amputated most of Earth’s rivers. But a new horizontal policy can lead to a competitive advantage. Whether scaled to tributaries or based on federal standards, the United States gains through dam consolidation, efficiencies, and innovation. Flexibility and incentives in a coast-to-coast market lower the transaction costs of repair or removal. Economies of scale would spur a substantial new dam removal and mitigation industry akin to the clean-air industry of scrubbers, software, and innovative technology sparked by the Clean Air Act or the Kyoto Protocol cap-and-trade policy. These don’t just bring down the costs of such policies in the United States; they create conditions for a competitive advantage for the United States. Exporting technology and skills will be in high demand beyond our borders, especially in China, Russia, and India, where most dams lie and where sedimentation and evaporation rates are high and dam safety and construction standards are low.

What is keeping this policy from emerging? Mostly it is because the competing governmental and nongovernmental organizations engaged in water think of dams as solitary entities locked within sectoral and jurisdictional cubicles. They fail to recognize that all dams have a national impact, positive and negative, on the life and livelihoods of communities throughout the United States.

A RIVER IS A DYNAMIC CONTINUUM, A VIBRANT LIFELINE, A FORCE OF ENERGY.

We regard as distinct each dam operated by the U.S. Bureau of Reclamation, Army Corps of Engineers, Tennessee Valley Authority, or Bonneville Power Administration. Together those public projects total half of the nation’s hydropower generation, but each is often seen as outside the laws that govern private hydropower authorized under the Federal Power Act. In turn, the 2,000 hydro dams overseen by the Federal Energy Regulatory Commission fall into one category and the 77,000 nonhydro (but federally registered) dams into another. We see 39,000 public dams as different from 40,000 private dams. We regulate irrigation dams differently from navigation dams and assign water rights to dams in western states but apply common law in eastern states, even when dams share the same river. Two dams on the same stream owned by the same company are subject to different environmental laws. We put 2.5 million small dams in a different category from 79,000 larger dams. The predictable mess is arbitrary and absurd and cries out for an overarching national policy.

Taking note of seemingly contradictory trends around dam construction and destruction worldwide, one might ask, “How far will the current trends go? How many old dams are we talking about repairing or removing? Hundreds? Thousands? A few big ones? A million little ones? Do we need more dams or fewer?”

Such questions largely miss the point of the policy envisioned here. We don’t need a specific number of dams, but rather we need healthier rivers, safer societies, and a more efficient and disciplined water-development infrastructure. How we get there is beyond the capacity of a single person to decide; only through a flexible horizontal market can we answer, together. A government policy can be the catalyst for and guide the direction of this market because it removes personal, political, ideological, and geographic biases from the equation. Nothing environmental and safety activists say or do can prevent new dam construction, and nothing dam supporters say or do can prevent old dams from coming down. But if the nation’s anti-dam and pro-dam interests were gathered collectively under the same fixed national ceiling and left to their own devices, Adam Smith’s “human propensity to truck, barter and exchange” could unite with the spirit of Thoreau’s civil “wildness.” A cap-and-trade dam policy’s embedded incentives would encourage the market’s invisible hand while ensuring its green thumb.

The United States once led the world in the construction of dams, but over time, many have deteriorated. Now, under a cap-and-trade policy, it can bring horizontal discipline to that vertical stockpile of fixed liabilities, reducing risks while improving the health and safety of living communities. The United States can once again show the way forward on river development. Through such a cap-and-trade policy it can help dams smoothly and efficiently evolve with the river economies to which they belong.

Let us close where we began, with Governor Schwarzenegger. If states are indeed the laboratories of U.S. democracy, he stands in a unique position to mount a market-based experiment for the United States as part of his agenda to build bigger, higher, and more new dams for water storage. He has already expanded in-state cap-and-trade schemes in water transfers, endangered species habitats, ocean fishery rights, and carbon emissions. He is open to the idea of removing the O’Shaughnessy Dam that has submerged Hetch Hetchy Valley in Yosemite National Park, even while he seeks more water storage elsewhere. Now, as the governor makes his pitch for big new multibillion dollar dams to save California from parched oblivion, he and other governors, not to mention heads of state from Beijing to Madrid to New Delhi to Washington, DC, could institute effective new policies to protect Earth’s liquid assets.


The Chrysanthemum Meets the Eagle

The interplay of U.S. and Japanese innovation policy began in the mid-19th century when Commodore Perry sailed into Tokyo Bay in 1853. The Japanese witnessed the technological power of a modern navy and the strategic implications of government investment in technology development. Recognizing the need to enhance its technological capacity, Japan soon began what became a mainstay of its innovation policy, scanning the globe for technologies that it could import and use.

These strategies remained essentially the same during the rest of the 19th century and first half of the 20th century. The United States continued to invest in military technology development in areas such as aviation and communications, and it also helped universities develop research capacity that would be useful to agriculture and industry. Japan maintained a relatively weak system of intellectual property protection, which was consistent with its position as mainly an importer of foreign technology. The government took an active role in subsidizing and supporting the industrial infrastructure it strove to develop in the national interest. A strong and highly capable elite bureaucracy was created to coordinate and support the efforts of the private sector in reaching this target. Japan’s drive for industrialization and the adoption of Western technology led to the establishment of its national university system and the founding of elite private universities, such as Keio and Waseda, modeled after institutions their founders had observed abroad.

World War II was enormously costly for Japan and Japanese industry, and much of the early postwar history of Japanese innovation policy concerns the rebuilding of a modern, technologically advanced economy out of the wartime rubble. Rapidly importing and adapting foreign technology was once again the key. Buoyed by the important role that technological innovation played in World War II, the United States expanded its investment in R&D and emphasized the importance of interaction among government, industry, and academia.

A seminal event for U.S. innovation policy was Japanese success in the global market for dynamic random access memory (DRAM) chips in the late 1970s and early 1980s.

Japanese technological capabilities first came onto the U.S. radar screen in the late 1950s, when the Japanese electronics industry succeeded in mastering the production of transistors for use in consumer electronics. To some extent, Japanese success in this arena was dependent on U.S. antitrust policy: As a price for dropping its antitrust litigation against AT&T, the Justice Department had required AT&T to license critical patents on the transistor for a reasonable fee to all comers, a mandate interpreted to include foreign companies. Massive U.S. imports of Japanese transistors, primarily assembled into inexpensive consumer electronics, provoked the first public campaign against high-tech Japanese imports. In a preview of debates to come, the U.S. electronics industry divided over how to react. Some component makers called for restrictions on Japanese imports, whereas the more advanced producers of the highest-tech devices (high-performance silicon transistors and early integrated circuits) argued that the key was to invest in newer, more advanced technology, leaving more mature, and hence less profitable, products for followers—such as the Japanese—to fight over.

Through most of the 1960s and early 1970s, a series of high-tech products, including televisions, then calculators, then digital watches, fell into this cycle of U.S. product innovation, followed by Japanese imitation, adaptation, and improvement. The cycle time between an initial U.S. innovation and successful Japanese improvement, and ultimately market dominance, seemed to get shorter and shorter. A similar story also played out in a product with a distinctly more mature and less high-tech character: the automobile. The common denominator in both cases was that Japanese improvements seemed typically to focus on continuous improvement of manufacturing processes and product quality, which resulted in a higher-quality product at lower cost. An explosion of interest in Japanese manufacturing techniques and Japanese industrial policies ignited U.S. industrial and policy circles in the late 1970s and early 1980s.

The result was a series of trade battles over Japanese exports. In addition to the more obvious weapons of trade policy (dumping cases, retaliatory tariffs, and quotas) some more creative armaments were also deployed. Japanese exporters of high-tech products into U.S. markets were sued over infringement of patents through the federal courts and through the U.S. International Trade Commission. Others focused on Japanese use of home market protection as an indirect method of subsidizing its high-tech industry and urged that political pressure be applied to Japan to lower the formal and informal barriers surrounding its high-tech markets, particularly for semiconductors and computers, where U.S. firms seemed to hold a clear technical lead.

A seminal event for U.S. innovation policy was Japanese success in the global market for dynamic random access memory (DRAM) chips in the late 1970s and early 1980s. DRAMs were the technology driver for the entire semiconductor industry: the highest-volume product, making use of the most advanced available manufacturing equipment. U.S. DRAM producers were shocked by the rapid advance of Japanese producers into the manufacture of the highest-tech current-generation chips in the early 1980s. Worse yet, customers were reporting that the reliability and quality of the Japanese chips exceeded those of the U.S. product. Even worse, the Japanese DRAM makers in some cases seemed to be selling at prices below U.S. producers’ costs and were using Japanese production equipment that seemed better than that available to U.S. makers.

Convinced that one of the keys to Japanese success was an innovation policy that enabled researchers from government and numerous companies to work cooperatively in R&D consortia, the U.S. Congress responded with a flurry of initiatives. The Stevenson-Wydler Technology Innovation Act of 1980 encouraged industry and government researchers to work together in Cooperative Research and Development Agreements (CRADAs). The Bayh-Dole University and Small Business Patent Act of 1980 was designed to encourage university researchers to transfer their technology to commercial companies. The National Cooperative Research Act (NCRA) of 1984 gave U.S. industry R&D consortia that registered with government some limited immunity from prosecution under U.S. antitrust laws. The SEMATECH consortium to improve semiconductor manufacturing technology was a successful example. The National Science Foundation expanded its support for basic scientific research to include more applied work, by funding the creation of engineering research centers where academic and industry researchers could work together. Steps whose ultimate effectiveness is still being debated were taken to strengthen the patent system, and the Department of Defense funded a billion-dollar Strategic Computing Initiative that helped U.S. industry overcome the challenge of Japan’s efforts to capture the lead in supercomputers.

Although scholars are divided in their assessment of the effectiveness of these U.S. policies, one result is undeniable: The perceived success of these U.S. innovation policy changes led Japan to alter some of its policies in the mid-1990s.

Japan redirects policy

There have been significant new developments in Japanese innovation policies since the 1990s, strongly influenced by U.S. developments in the 1980s. They include a significant increase in funding in the science and technology budget, coupled with major institutional reforms in national universities and research laboratories; measures to strengthen industry and academic science partnerships, including the enactment of the Japanese version of the Bayh-Dole Act; and a significant strengthening of intellectual property rights protection. The most important reason for these changes was the recognition by policymakers that Japan needed to strengthen its innovation capability as an engine of economic growth, given that the catch-up phase of Japanese economic growth was over. This perception was widely shared, as shown by the fact that the Basic Law on Science and Technology, which set the new framework for science and technology policymaking, received unanimous support from all political parties when enacted in 1995. The policy emphasis on innovation increased as the stagnation of Japan’s economy extended over almost a decade.

The U.S. model of an innovation system has strongly influenced the development of Japanese innovation policy. It is widely believed in Japan that the strong basic research capability of U.S. universities supported by a high level of federal support, close collaboration between industry and universities, and strong protection of intellectual property rights have been major contributing factors to the impressive recovery of the U.S. economy since the early 1980s. More specifically, the general perception in Japan is that significant government support for basic or generic research, combined with strong research competition, has enabled U.S. research universities to continuously create scientific discoveries, retain leadership in global scientific research, attract the best talent in the world, and accumulate know-how and human capital in technological frontier areas. Close partnerships between universities and industry have enabled basic scientific capabilities to be transformed into emergent new industries in areas such as biotechnology and information technology. The Bayh-Dole Act, encouraging patent ownership by universities, is believed to have been an important reform stimulating this process, by enhancing the incentives for university professors to engage in technology transfer. Finally, strong protection of intellectual property rights in the United States is thought to have stimulated private R&D investments in risky frontier areas. This popular interpretation of the U.S. experience led to major Japanese policy initiatives in three areas: research, partnerships, and intellectual property rights protection.

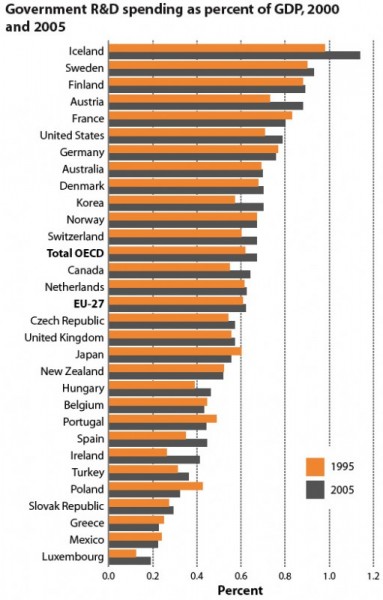
More research support. Four major changes in research policy have taken place. First, there has been a significant expansion of government support for research, prescribed in the five-year Science and Technology Basic Plans, starting in 1996. This happened despite the dire fiscal situation created by continuing economic stagnation. As a result, the ratio of government-funded research to gross domestic product (GDP) increased over the past decade from 0.60% in the first half of the 1990s to 0.67 % in the latter part of the 1990s, and then to 0.69% in the first half of the 2000s. This compares with 0.83% of GDP in the United States in 2004 and 0.76% in Germany (including military R&D budgets in these figures). The expansion of government funding helped modernize the research facilities in national universities and laboratories, which had become increasingly obsolete due to underinvestment in previous years. The budget expansion also enabled a significant amount of new research investment in four priority areas: life science, information and communication, the environment, and nanotechnology/new materials. The share of the R&D budget allocated to these priority areas increased from 29.1% in early 1990s to 38.6% in early 2000s.

In semiconductors in particular, Japanese government funding for R&D consortia had dimmed in the face of trade friction with the United States in the 1980s. By the mid-1990s, however, as the U.S. SEMATECH effort seemed to produce results and the competitive fortunes of U.S. semiconductor producers rebounded, the Japanese semiconductor industry began a decline in the face of intensified global competition. Japan launched a new round of industrial, university, and private R&D consortia (with names such as SELETE, STARC, and ASET) that seemed modeled, in part, on SEMATECH and growing government/industry/university collaborative efforts in the United States.

Second, there have been a number of important institutional reforms. The portion of research funding allocated through competition has increased significantly. It rose almost sixfold during the period from 1991 to 2005. Perhaps most important, national universities and national research institutes have been transformed from government entities into independent nonprofit institutions, starting in April 2004. This transformation was motivated in large part by a government desire to reduce the number of national civil servants by the end of fiscal year (FY) 2003. However, it has also greatly increased freedom in activities undertaken at Japanese universities. Because national universities and laboratories account for the bulk of scientific and technological research within the Japanese university system, their independence should enhance research flexibility and efficiency over the long term.

Since one might expect a significant lag before policy reforms affect research performance at national universities and laboratories, it is too early to assess their impact. However, some statistical indicators are available. The 2006 White Paper on Science and Technology suggests that the research performance of Japanese scientists has improved, although the gain may not be impressive. The share of Japanese researchers in both numbers and citations of scientific papers in major scientific journals has increased significantly over the past two decades. Japan’s share of papers published increased from less than 7% in 1981 to around 10% in 2004 (compared with 32% for the United States), while its share of citations increased from less than 6% in 1981 to around 9% in 2004 (compared with the U.S. share of 48%). There remain, however, doubts about the impact of the increases in government expenditures for science and technology on enhancing industrial innovations in Japan to date.

Stronger partnerships. There once was strong collaboration between universities and industry in Japan. For an example, the Department of Engineering of Tokyo University, established in 1873 as the first engineering department in a university in the world, played a major role in facilitating the absorption of foreign advanced technology within Japan. University professors also contributed as industrial inventors when the R&D capability of Japanese firms was weak. A good example is the former RIKEN (Institute of Physical and Chemical Research), which successfully incubated a number of new firms based on the inventions of university professors. However, university/industry partnerships had become less important by the late 1960s and 1970s, as the absorptive and R&D capability of Japanese firms strengthened and as student political activism and turbulence on campus discouraged such partnerships.

The importance of the university has reemerged in Japanese research in recent years, because it is now expected to play a central role in creating the foundation for industrial innovation. In both the United States and Japan, a university is a major player in basic R&D, accounting for 62.0% and 46.5% of basic research, respectively, in the United States and in Japan. Thus, improved efficiency in technology transfer from university to industry could play a major role in strengthening science-driven industry. There has been significant institutional reform in Japan designed to pursue this objective

First, Japanese policymakers have adopted a system of technology transfer based on the principle of university ownership of patent rights, following precedents set out in the Bayh-Dole Act. In particular, the Japanese version of the law (the Law on the Special Measures for Revitalizing Industrial Activities), which was enacted in 1999, permits the retention by the grantees or by contractors of the patents to the inventions derived from publicly funded research. In 1998, legislation to promote the establishment and activities of Technology Licensing Organizations (TLOs) was enacted, and today all Japanese universities with major scientific and engineering research capability have technology transfer offices. After national universities were incorporated in 2004, most of them adopted employment contracts containing an invention-disclosure obligation for faculty members and a transfer of ownership of inventions to the university. As in the United States, an inventor owns patent rights even if he is employed, unless otherwise agreed. In the past, it often used to be the case that when a university professor supported by a research grant made an invention, the patent rights to the invention were transferred to a private company because universities did not have the institutional capabilities to support the filing, licensing, and enforcement of patents.

Second, the government has encouraged collaborative research among industry, universities, and national research laboratories, as well as the incubation of new business entities derived from these organizations. The government started by helping to establish collaborative research centers in national universities after 1987. The government has also provided research grants targeting university/industry joint research through programs such as Research Grants for University-Industry Collaborative Research, which began in FY 1999. In 1995, it began supporting the establishment of Venture Business Laboratories to help startup companies. Finally, the 2000 Law on the Enhancement of Industrial Technologies relaxed regulations preventing national university professors from serving as board members of private companies, particularly when this is helpful for technology transfer.

Although there is a long tradition of university/industry collaboration in Japan at the individual professor level, Japanese universities did not provide institutional support for such collaboration until recently.

Again, it is too early to assess the full impact of this reform. However, there are hints of some notable changes. The number of annual domestic patent applications by universities and approved TLOs has increased substantially, from 641 in 2001 to 8,527 in 2005. The number of domestic patent applications is at a level equivalent to that of U.S. universities (6,509 in year 2002). In addition, the number of university/industry joint research projects increased from less than 1,500 annually in 1995 to more than 10,000 in 2005. The number of academic industrial spinoffs has also increased significantly (179 in Japan in 2003, compared with 364 in the United States in 2002).

On the other hand, the amount of licensing revenue received by Japanese universities is still tiny (less than 0.5% of the U.S. level), and the number of academic startups that have reached the initial public offering stage is also tiny. The apparent impact of university research on industrial innovation, by these measures, is still very small. The short history of university ownership of patents is one explanation, but other possible causes are the absence of really valuable university inventions, lack of experience in patenting and licensing strategies, and a weak infrastructure for supporting high-technology startups, including limited availability of risk capital and professional services.

Intellectual property protection. Although Japan has a long history of intellectual property rights (IPR) protection (the first full-fledged patent law was enacted in 1885), IPR protection in Japan has been significantly strengthened since the early 1990s. Initially, the impetus for such change came from abroad: a U.S.-Japan agreement in 1994 and the Trade-Related Aspects of Intellectual Property Rights agreement negotiated in creating the World Trade Organization in 1995. Subsequently, however, further changes have been a core domestic reform initiative in Japan. Extensive reforms since 2000 include the implementation of the series of action plans coordinated by the Intellectual Property Policy Headquarters headed by the prime minister since 2002 (including the enactment of the Basic Law on Intellectual Property in 2003), and the 2005 establishment of the Intellectual Property High Court, modeled on the U.S. Court of Appeals of the Federal Circuit.

Stronger penalties to deter infringement have been a major policy change. The patent law was revised in 1998 to reinforce the private damages system, increase criminal sanctions, and improve the ability of a patentee to collect evidence of infringement. The amendments introduced a new provision that allows a patentee to presume the amount of damages due to infringement, based on the sales made by an infringer and on the profit rate of the patentee. The law was further amended in 1999, again strengthening the power of a patentee to collect evidence needed to show infringement of a patent.

Second, there has been an expansion of patentable subject matter in the field of computer programs. A major constraint in Japan was that the patent law defines an invention eligible for patent as a “technical idea utilizing natural laws.” Reflecting this qualification, a computer program per se was not patentable, unless it was a part of an invention using hardware. It became patentable in 1997, when recorded in a computer-readable storage medium. In 2000, computer programs themselves became eligible to be product patents.

Third, the Japanese Supreme Court affirmed the “doctrine of equivalents” in 1998. The Supreme Court ruled, among other things, that “equivalence” should be determined on the basis of technologies available at the time of the infringement, not at the time of the patent application. Thus, the modifications that are obvious given the technologies available at the time of infringement are deemed equivalent. After this ruling, 140 cases involving the issue of equivalence were initiated from 1998 to 2003, and equivalence was recognized by the courts in 15 cases during this period.

Fourth, in 1994 there was a switch from a pre-grant opposition system to a post-grant opposition system. The pre-grant opposition system allowed any person to oppose a patent before it was formally granted, which was one source of delays in patent examination in Japan in the early 1990s. Even though it provided a mechanism for a third party to add valuable information on prior art, it also opened the door for a competitor to file opposition without substantial merit. The post-grant opposition system was integrated into invalidation trials after 2004, in order to provide a definitive resolution of conflicts between a patent applicant and opponents.

The level of IPR protection in Japan is now widely recognized to be very high. According to the assessment by the Business Software Alliance of the level of business software piracy, Japan is the third lowest (25%) in 2006, trailing only the United States (21%) and New Zealand (22%). The effect on innovation is more difficult to assess. The number of patent examination requests has increased substantially over time. This may indicate that the value of patents has risen, encouraging R&D by Japanese firms. Stronger protection of IPR may have also strengthened R&D rivalry among firms and therefore increased R&D. On the other hand, the increasing complexity of patent claims and the increasing number of requests for patent examinations are putting strong pressure on scarce examination capacity at the Japanese Patent Office. The proliferation of patents and other intellectual property rights can deter rather than promote innovation by hindering a firm from combining technologies efficiently because of high transaction costs, holdup risk, and inefficiency in chains of vertical monopolies, given the difficulty of forming and coordinating coalitions to exploit elements of technology owned by different firms.

Where does this dance lead?

There have been significant changes in Japanese innovation policy since the 1990s, influenced by the perceived success of U.S. innovation policy initiatives in the 1980s. These U.S. policy changes of the 1980s in turn were developed in response to increased high-tech competition from Japanese firms. Although it will require significantly more evidence and research in order to evaluate the full effects of these changes on U.S. and Japanese innovation policies, some preliminary observations can be made with respect to the lessons learned and challenges faced in both systems since the 1990s.

First, policy reform in Japan has placed priority on strengthening competitive mechanisms in creating innovations, emulating a process that is regarded as a main source of strength in the U.S. innovation system. A substantial expansion of competitive research funding, the privatization of national universities and public laboratories, and stronger IPR protection are best interpreted as important steps in that direction. Because competition not only strengthens the intensity of a race for research results but also helps avoid duplication in research and facilitates the division of labor in research, both locally and globally, this policy shift seems to be clearly pointed in the right direction.

Second, recent innovation system reforms in Japan also put priority on strengthening university and industry partnerships, another major source of strength in the U.S. innovation system. Although there is a long tradition of university/industry collaboration in Japan at the individual professor level, Japanese universities did not provide institutional support for such collaboration until recently. Stronger institutional support for collaborative research, licensing, and high-tech startups would strengthen technology transfer from university to industry. Even in the United States, however, how a university can best contribute to industrial innovation remains controversial. Some argue that universities can best contribute through research excellence, transmitted via good scientific publications, and education, and that university/industry partnerships may crowd out these more traditional but core activities. In addition, the effectiveness of these partnerships may depend on the availability of complementary institutions, such as infrastructure for supporting high-tech startups, including the availability of risk capital and professional services. This suggests that a model that works well in the United States may not work in Japan. More research—and experience—may be needed to resolve this complex issue.

Third, although IPR protection is an important stimulus to innovation, current systems seem far from perfect. How effectively IPR protection serves the goal of innovation may depend on details of institutional design and management. Excessive protection of IPR under a low standard of non-obviousness or inventiveness may motivate firms to apply for patents for low-quality inventions, which can stifle innovation. High standards for granting patent protection and efficient use of third-party information in patent examination may be very important. Furthermore, the proliferation of IPR can deter innovation in technology areas where progress is cumulative by creating a “patent thicket” problem. It is important to improve the efficiency of technology markets, including licensing mechanisms for patents related to industrial standards.

Fourth, it is important to strengthen mechanisms for international collaboration. Because knowledge flows do not respect borders, and high-tech competition has become global, efficiency in knowledge production and use will often involve global solutions. The success of International SEMATECH in coordinating and accelerating global semiconductor innovation through the international semiconductor technology roadmap is a good example of how a global approach to coordinating private and public innovation investments can be effective. International sharing of databases and international coordination of patent examinations among major national patent offices may also help improve the quality of patent examinations worldwide and contribute to an improved global innovation system.

Forum – Fall 2007

Science policy matters

Daniel Sarewitz asks, “Does Science Policy Matter?” (Issues, Summer 2007). The answer is “absolutely yes.” In a high-tech global economy, science and technology are indispensable to maintaining America’s economic edge. In fact, historically, studies have shown that as much as 85% of the measured growth in per capita income has been due to technological change. In a very real sense, the research we do today is responsible for the prosperity we achieve tomorrow. For that reason, I believe Congress must support low tax rates as a catalyst for innovation.

Ever since President Reagan’s tax cuts went into full effect in 1983, the U.S. economy has almost quintupled in size, the Dow Jones Industrial Average has surged from less than 1,000 to over 13,000, and a host of revolutionary technologies, from cell phones to DVDs, from iPods to the Internet, have enhanced productivity and our quality of life. In many cases, the low tax rates enabled dynamics entrepreneurs to secure the private investment they needed to create their own businesses, and in effect, jump-start the information revolution.

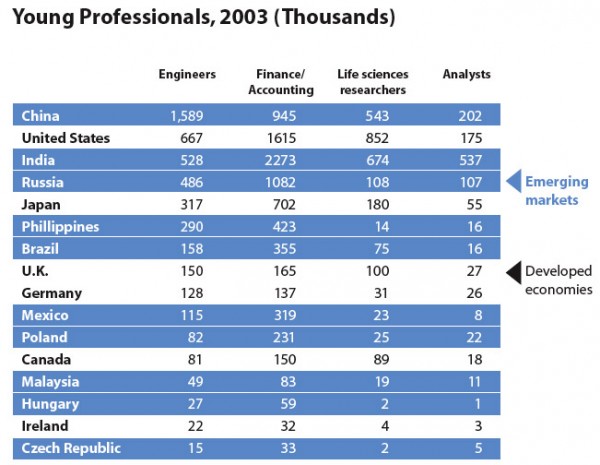
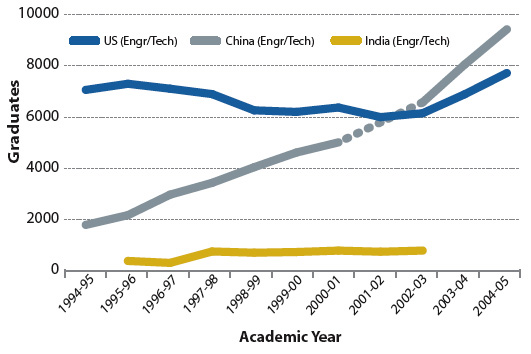
But despite our economic gains, Congress needs to play a more active role in shaping science and technology policy with federal funding. Last year, the National Academies released a startling report called Rising Above the Gathering Storm, which showed how unprepared we are to meet future challenges. According to the report, the United States placed near the bottom of 20 nations in advanced math and physics, and ranked 20th among all nations in the proportion of its 24-year-olds with degrees in science or engineering. Right now, we are experiencing a relative decline in the number of scientists and engineers, as compared with other fast-growing countries such as China and India. Within a few years, approximately 90% of all scientists and engineers in the world will live in Asia.

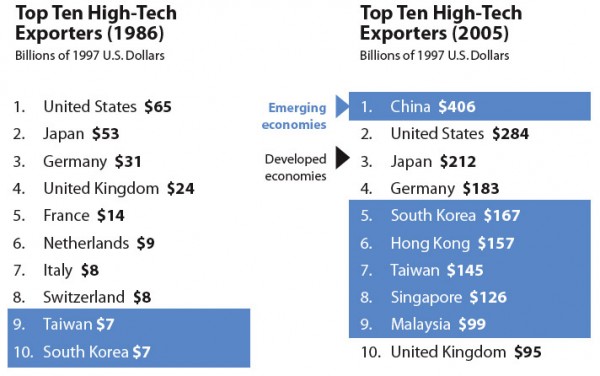
We are starting to see the consequences of our neglect in these fields. In the 1990s, U.S. patent applications grew at an annual rate of 10%, but since 2001, they’ve been advancing at a much slower rate (below 3%). In addition, the U.S. trade balance in high-tech products has changed dramatically, with China overtaking the United States as the world’s largest exporter of information-technology products (and the United States becoming a net importer of those products).

I agree with Sarewitz that “the political case for basic research is both strong and ideologically ecumenical,” as people across the political spectrum view scientific research as an “appropriate area of governmental intervention.” For example, Congress recently passed the America Competes Act. This landmark legislation answered the challenge of the report from the National Academies to increase research, education, and innovation and make the United States more competitive in the global marketplace.

In addition, federal funding for basic research has increased substantially, although I am growing concerned that the emphasis of that funding is starting to shift from hard science to soft science. As government leaders, we have a responsibility to establish priorities for the taxpayers’ money; and in that case, hard sciences (physical science and engineering) must assume a larger share of federal funding.

The bottom line is science policy does matter—and I thank you, as leaders of the scientific community, for your efforts to make the United States a better place to live, learn, work, and raise a family.

SEN. KAY BAILEY HUTCHISON

Republican of Texas


Daniel Sarewitz’s “Does Science Policy Matter?” continues the tutorial begun with his 1996 Frontiers of Illusion, still one of the most compelling myth-busting texts for teaching science policy. More policy practitioners should read it, or at least this updated article.

Sarewitz carries the mantle of the late Rep. George Brown, for whom he worked through the House Science Committee. I did, too, as study director for the 1991 Office of Technology Assessment report Federally Funded Research: Decisions for a Decade, which Sarewitz cites. In it, and subsequently in a Washington Post editorial titled “How Much Is Enough?” the following questions were raised:

“Is the primary goal of the Federal research system to fund the projects of all deserving investigators . . .? If so, then there will always be a call for more money, because research opportunities will always outstrip the capacity to pursue them.

Is it to educate the research work force or the larger science and engineering work force needed to supply the U.S. economy with skilled labor? If so, then support levels can be gauged by the need for more technically skilled workers. Preparing students throughout the educational pipeline will assure an adequate supply and diversity of talent.

Is it to promote economic activity and build research capacity through the United States economy by supplying new ideas for industry and other entrepreneurial interests? If so, then the support should be targeted …to pursue applied research, development, and technology transfer.

Is it all of the above and other goals besides? If so, then some combination of these needs must be considered in allocating federal support.

Indicators of stress and competition in the research system do not address the question of whether science needs more funding to do more science. Rather, they speak to the organization and processes of science and to the competitive foundation on which the system is built and that sustains its rigor” (Federally Funded Research, May 1991, p. 12).

Though a generation old, these words are effectively recast by Sarewitz as an indictment of the science policy community, to wit:

“. . . the annual obsession with marginal changes in the R&D budget tells us something important about the internal politics of science, but little, if anything, that’s useful about the health of the science enterprise as a whole.

“We are mostly engaged in science politics, not science policy …. this is normal science policy, science policy that reinforces the status quo.

“If the benefits of science are broadly and equitably distributed, then ‘how much science can we afford?’ is a reasonable central question for science policy.”

Taken together, these observations require, in Sarewitz’s words, “that unstated agendas and assumptions, diverse perspectives, and the lessons of past experiences be part of the discussion.” That the policy community shuns such self-examination suggests that it is more an echo of the science community than a critical skeptic of it, more a political body than an analytical agent.

To be sure, Sarewitz scolds science policy for being ahistorical and nonaccumulative in building and applying a knowledge base. He proposes a new agenda of questions that starts with the distribution of scarce resources and extends to goals, benefits, and outcomes. He continues to challenge his colleagues to heed the world while reinventing our domestic policy consciousness for the 21st century. He does nothing less than ask science policy to find its soul.

DARYL E. CHUBIN

Director, Center for Advancing Science and Engineering Capacity

American Association for the Advancement of Science

Washington, DC


Science education for parents

Rep. Bart Gordon has been a champion of science and math in Congress, and we agree completely that the necessary first step in any competitiveness agenda is to improve science and math education (“U.S. Competitiveness: The Education Imperative,” Issues, Spring 2007). For over two years now, scores of leading policymakers and business leaders have been calling for reforms in science, technology, engineering, and mathematics education and offering a myriad of suggestions on how to “fix the problem.”

Before we can fix the problem, however, we have to do a much better job of explaining what is actually broken. A survey last year of over 1,300 parents by the research firm Public Agenda found that most parents are actually quite content with the science and math their child receives. Fifty-seven percent of the parents surveyed say that the amount of math and science taught in their child’s public school is “fine.” At the high school level, 70% of parents are satisfied with the amount of science and math education.

Why is there such a disconnect between key leaders and parents? Clearly we have to get parents to realize that there is, in fact, a crisis in science and math education and it’s in their neighborhood too.

With all the stakeholders on board, we can work together to ensure that innovations and programs are at the proper scale to have a significant impact on students. We can ensure that teachers gain a deeper understanding of the science content they are asked to teach, and we can do a much better job of preparing our future teachers. Together we need to overhaul elementary science education and provide all teachers with the support and resources they need to effectively teach science. Our nation’s future depends on it.

GERALD WHEELER

Executive Director

National Science Teachers Association

Arlington, VA


Large effects of nanotechnology

Ronald Sandler and Christopher J. Bosso call attention to the opportunity afforded to the National Nanotechnology Initiative (NNI) to address the broad societal effects of what is widely anticipated to be a transformative technology (“Tiny Technology, Enormous Implications,” Issues, Summer 2007).

From its beginnings, the federal agencies participating in the NNI have recognized that the program needs to support activities beyond research for advancing nanotechnology and have included funding for a program component called Societal Dimensions, which has a funding request of $98 million for fiscal year 2008.

The main emphasis of this program component has been to advance understanding of the environmental, health, and safety (EHS) aspects of the technology. This funding priority is appropriate because nanomaterials are appearing in more and more consumer products, while basic knowledge about which materials may be harmful to human heath or damaging to the environment is still largely unavailable. In fact, the NNI has been criticized for devoting too little of its budget to EHS research and for failing to develop a prioritized EHS research plan to inform the development of regulatory guidelines and requirements.

Nevertheless, the article is correct that there are other public policy issues that need to be considered before the technology advances too far. The NNI has made efforts in this direction. A sample of current National Science Foundation grants under its program on ethical, legal, and social implications (ELSI) issues in nanotechnology includes a study on ethical boundaries regarding the use of nanotechnology for human enhancement; a study on societal challenges arising from the movement of particular nanotechnology applications from the laboratory to the marketplace and an assessment of the extent to which existing government and policy have the capacity (resources, expertise, and authority) to deal with such challenges; a study on risk and the development of social action; and a project examining nanoscale science and engineering policymaking to improve understanding of intergovernmental relations in the domain of science policy.

Although the NNI is not ignoring broader societal impact issues, the question the article raises is whether the level of attention given and resources allocated to their examination are adequate. The House Science and Technology Committee, which I chair, will attempt to answer this question, and will examine other aspects of the NNI as part of its reauthorization process for the program that will be carried out during the current Congress.

REP. BART GORDON

Democrat of Tennessee

Chairman, U.S. House Committee on Science and Technology


The article by Ronald Sandler and Christopher J. Bosso raises important issues concerning the potential benefits and impacts of nanotechnology. The authors’ focus on societal implications points to considerations that apply specifically to nanotechnology as well as generally to all new or emerging technologies. In striving to maximize the net societal benefit from nanotechnology, we need to examine how we can minimize any negative impacts and foresee—or at least prepare for— unintended consequences, which are inherent in the application of any new technology.

The U.S. Environmental Protection Agency (EPA) recognizes that nanotechnology holds great promise for creating new materials with enhanced properties and attributes. Already, nanoscale materials are being used or tested in a wide range of products, such as sunscreens, composites, medical devices, and chemical catalysts. In our Nanotechnology White Paper (www.epa.gov/osa/nanotech.htm), we point out that the use of nanomaterials for environmental applications is also promising. For example, nanomaterials are being developed to improve vehicle fuel efficiency, enhance battery function, and remove contaminants from soil and groundwater.

The challenge for environmental protection is to ensure that, as nanomaterials are developed and used, we minimize any unintended consequences from exposures of humans and ecosystems. In addition, we need to understand how to best apply nanotechnology for pollution prevention, detection, monitoring, and cleanup. The key to such understanding is a strong body of scientific information; the sources of such information are the numerous environmental research and development activities being undertaken by government agencies, academia, and the pri-vate sector. For example, on September 25 and 26 of this year, the EPA is sponsoring a conference to advance the discussion of the use of nanomaterials to prevent pollution.

The EPA is working with other federal agencies to develop research portfolios that address critical ecological and human health needs. We are also collaborating with industry and academia to obtain needed information and identify knowledge gaps. Nanotechnology has a global reach, and international coordination is crucial. The EPA is playing a leadership role in a multinational effort through the Organization for Economic Cooperation and Development to understand the potential environmental implications of manufactured nanomaterials. Also on the international front, we are coordinating research activities, cosponsoring workshops and symposia, and participating in various nanotechnology standards-setting initiatives.

We are at a point of great opportunity with nanotechnology. From the EPA’s perspective, this opportunity includes using nanomaterials to prevent and solve environmental problems. We also have the challenge, and the responsibility, to identify and apply approaches to produce, use, recycle, and eventually dispose of nanomaterials in a manner that protects public health and safeguards the natural environment. Using nanotechnology for environmental protection and addressing any potential environmental hazard and exposure concern are important steps toward maximizing the benefits that society derives from nanotechnology.

JEFF MORRIS

Acting Director

Office of Science Policy

Office of Research and Development

U.S. Environmental Protection Agency

Washington, DC


I read with great interest the piece by Ronald Sandler and Christopher J. Bosso on nanotechnology. It is hard to argue with their assertion that the social and environmental implications of nanotechnology will be wide-ranging and deserve the attention of the government. However, their faith in the National Nanotechnology Initiative (NNI) as a mechanism to address these issues seems misplaced.

The NNI’s governance and overall coordination are done through the National Science and Technology Council. To date, the NNI has functioned as an R&D coordination body, not a broader effort to develop innovative regulatory or social policy. It is questionable whether many of the issues that the authors raise, such as environmental justice, could be dealt with effectively by the NNI. Even some of the issues that lie within the NNI’s competency and mandate have not been adequately addressed.

For example, six years after the establishment of the NNI, we lack a robust environmental, health, and safety (EH&S) risk research strategy for nanotechnology that sets clear priorities and backs these with adequate funding. The House Science Committee, at a hearing in September 2006, blasted the administration’s strategy (Rep. Bart Gordon described the work as “juvenile”). A lack of transparency by the NNI prompted the Senate Commerce Committee in May 2006 to request that the General Accountability Office audit the agencies to find out what they are actually spending on relevant EH&S research and in what areas.

Another issue raised in the article that needs urgent attention is public engagement, which must go beyond the one-way delivery of information on nanotech through museums, government Web sites, and PBS specials. Though this need was clearly articulated in the 21st Century Nanotechnology R&D Act passed in 2003, the NNI has held one meeting, in May 2006, to explore how to approach public engagement, not to actually undertake it.

The authors correctly call for a regulatory approach that goes beyond the reactive incrementalism of the past decades. However, the Environmental Protection Agency’s recent statement that the agency will treat nano-based substances like their bulk counterparts under the Toxic Substances Control Act—ignoring scale and structure-dependent properties that are the primary rationale of much NNI-funded research—hardly gives the impression of a government willing to step “out of the box” in terms of its regulatory thinking and responsibilities.

As more and more nano-based products move into the marketplace, the social and environmental issues will become more complex, the need for public engagement more urgent, and the push for effective oversight more critical. The authors are right in calling for the NNI to step up to these new challenges. The question is whether they can or will.

DAVID REJESKI

Director

Project on Emerging Nanotechnologies

Woodrow Wilson Center

Washington, DC


The importance of community colleges

I appreciate the invitation to respond to James E. Rosenbaum, Julie Redline, and Jennifer L. Stephan’s “Community College: The Unfinished Revolution” (Issues, Summer 2007). I will focus my remarks on how the U.S. Department of Education is assisting community colleges to carry out their critical multifaceted mission.

The Office of Vocational and Adult Education (OVAE), under the leadership of Assistant Secretary Troy Justesen, is committed to serving the needs of community colleges, as evidenced by my appointment as the first Deputy Assistant Secretary with specific responsibility for community colleges. As a former community college president with experience in workforce education, I bring first-hand knowledge to our community college projects and services.

Comprehensive community colleges have a priority to be accessible and affordable to all who desire postsecondary education. They prepare students for transfer to four-year institutions, meet workforce preparation needs, provide developmental education, and offer a myriad of support services needed by students with diverse backgrounds, skills, and educational preparation. Community colleges also have thriving noncredit programs that encompass much of the nation’s delivery of Adult Basic Education and English as a Second Language instruction. Noncredit programs often include customized training for businesses, plus initiatives that range from Kids College to Learning in Retirement. Many community colleges use innovative delivery systems such as distance education, making courses and degrees accessible 24/7 to working students and those with family responsibilities.

In the report A Test of Leadership, the commission appointed by Secretary of Education Margaret Spellings made recommendations to chart the future of higher education in the United States. Accessibility, affordability, and accountability emerged from the report as key themes in the secretary’s plan for higher education. Comprehensive community colleges are well-poised to move on these themes and are doing this work in the context of national and global challenges raised by the commission.

At a Community College Virtual Summit, Education Secretary Spellings said, “you can’t have a serious conversation about higher education without discussing the 11 million Americans (46% of undergraduates) attending community colleges every year.” The Virtual Summit is one of a series of U.S. Department of Education activities related to the secretary’s plan for higher education.

Community college leaders and researchers underscored the importance of accountability during the summit and the need for data-driven decisionmaking. For example, initiatives such as Achieving the Dream and Opening Doors focus on data-directed support services in community colleges. The average age of community college students is 29, reflecting the large number of working adults who attend; however, growing numbers of secondary students are also attending community colleges. These “traditional”-age community college students are well prepared for higher academic challenges. Many of these students transfer before they complete the Associate of Arts or Associate of Science degree and often are not recognized as community college successes. Many students also return to their local community college in the summer and during January terms to complete additional courses. Often overlooked when discussing degree completion results are the data that show that more than 20% of community college students already have degrees.

New OVAE projects focused on community colleges include a research symposium and a showcasing and replication of promising practices that will produce additional information. Moreover, the College and Career Transitions Initiative has developed sequenced career pathways from high school to community college that encompass high academic standards. Outcomes of this project include a decrease in remediation, increases in academic and skill achievement, the attainment of degrees, and successful entry into employment or further education. Community colleges using best practices offer a pathway model with multiple entry points for adults and secondary students; end-point credentials; and “chunking,” which organizes knowledge in shorter modules with credentials of value early in the process to allow for periods of work. The use of chunking with pathway models is a practice recommended in a recent report by the National Council of Workforce Education and Jobs for the Future.

Students of all ages come to community colleges with many different educational goals. They are vital entry points to postsecondary education for new Americans, nontraditional and traditional students alike. When comparing the cost of the first two years at a public community college with the cost at a four-year public university, it is apparent why community colleges gained support from the president and state governors as the postsecondary institutions of first choice for millions of Americans.

PAT STANLEY

Deputy Assistant Secretary

U.S. Department of Education

Washington, DC


Data-driven policy

In “The Promise of Data-Driven Policymaking” (Issues, Summer 2007), Daniel Esty and Reece Rushing describe the U.S. health system as ripe for the improved use of aggregated information in support of better policy and clinical decisions. Let me highlight two challenges they did not address.

First, much of our thinking about data acquisition and analysis for government decisionmaking reflects a 20th century information paradigm rather than the Web 2.0 model that pervades so much of society now. In many domains, and certainly in health care, we don’t rely on top-down policy development and enforcement. Instead, data for decisionmaking must be widely available and subject to analysis by diverse stakeholders, ranging from the organizations directly subject to regulation to the public interest groups and individuals who wish to learn from or add to society’s evidence base in each area. Similarly, the evidence for decision-making is not determined by a single national authority (often after years of review, sign-off, and political vetting) but represents a dynamic stream of insight built by numerous interested parties engaged in a continuing dialogue. We need both a policy regime and a technology infrastructure that support decentralized and distributed data resources and that protect individual privacy and other public values. This architecture needs to be open and fluid, accommodating new data contributions, new methodologies, and new opinions.

Second, although we certainly lack sound actionable data for health policy decisionmaking, data alone do not affect how decisions are made, and new technology will not change that. In health care, there’s been much furor over the Institute of Medicine (IOM) reports since 1999 revealing both high rates of preventable medical errors and evidence of poor-quality care. But in 1985, the federal government published voluminous data on individual hospital mortality rates, and in the early 1990s a federal research agency developed and published recommended evidence-based practices for conditions such as managing low back pain. In both cases, the affected stakeholders—the hospital associations and the back surgeons— acted politically to crush the federal efforts at publishing relevant data. In neither case was technology the key lubricant of evidence-based policymaking— it was the short-lived will of federal officials to increase transparency, diffuse information, and demand improved quality in our health system.

When political forces favoring transparency can’t be stopped, the industry is often successful at negotiating systems that create the illusion of disclosure by releasing data that poses little risk of disrupting current practice. Over the past decade, federal and state agencies have been determined to publish “performance” data about hospitals, nursing homes, and doctors, but they’ve allowed the industry to decide what measures should be reported. As a result, we are swamped with measures that have no value to consumers or purchasers and do nothing to stimulate innovation, competition, or systemic improvement. These data will never address the issues that Medpac or the IOM or our presidential candidates are talking about: how to best care for people with chronic illnesses such as asthma and diabetes, how to deal with the challenges of obesity, how to provide access to millions of uninsured Americans, or how to provide quality care at the end of life.

Evidence-based policymaking is an important goal, but it becomes important when it allows policymakers and the larger community to discover new ways to solve intractable problems.

DAVID LANSKY

Senior Director, Health Program

Markle Foundation

New York, NY


Daniel Esty and Reece Rushing’s helpful article notes that the ability to collect, analyze, and synthesize information has never been as promising as it is today. Whether it’s fighting crime or monitoring drinking water, analysts and policymakers of many stripes, not just government leaders, have unprecedented opportunities to obtain information at faster rates and more extensively than ever before.

Current technology can make real-time data collection and analysis possible without regard to geography, and such data can be made publicly available to all. This should enable quicker, smarter decisions. It also means that decisions about priorities, resource allocations, and performance can be made more easily visible to constituents and consumers, allowing for more informed choices and greater accountability of decisionmakers.

What is not new is the ongoing challenge in building an information infrastructure that can enable this data-driven policymaking. Among the many challenges, here are three. The public is eager to examine government data. Yet the underlying data from government have many errors that can lead one to wrong conclusions. Until this is addressed, data-driven decisions will always be suspect. Second, the strength of newer information technologies is the ability to link disparate data in order to create profiles that previously could not be obtained. But linking such data sets is very difficult because government has no system of common identifiers. Finally, the government has a Janus-faced approach to data collection. In one breath, government calls for benchmarks to assess performance and in the next calls for an annual 5% reduction in information collected. This inconsistency must stop.

Even if we had an ideal information infrastructure, do we want all decisions to be driven by quantifiable data? No. Some decisions are more appropriately driven by rigorous quantitative analysis, others less so. Science should guide policymakers, but human judgment is needed to make decisions. Esty and Rushing note that one promise of data-driven decisionmaking is that it will harpoon one-size-fits-all decision-making in government. That would be good. But this also raises tough questions about what benchmarks to use for performance measurement. Although some benchmarks can be established by statutory mandates, much is left to human discretion and ultimately to politics.

We must also remember that science is not value-free. Relying solely on performance measures to guide decisions may create incentives to manipulate data or cause the complexities of crafting policies to address difficult problems, such as hunger in the United States or balancing civil liberties and security, to be ignored. Moreover, key assumptions used in research may change results exponentially. For example, assessing risk for the general public could have vastly different results, conclusions, and policy decisions than assessing risk for vulnerable subpopulations. Although numbers can help inform and support policy decisions, they should not alone create solutions to policy problems.

Presumably, Esty and Rushing are writing this article because they believe that government is currently not relying on data to make its decisions. Yet the Bush administration would probably disagree, arguing it relies on data, citing, for example, regulatory decisions that are based on cost/benefit analysis. We would assert that the Bush administration has used data to manipulate regulatory and performance outcomes, allowing political goals to trump science. Ultimately, this suggests that the debate is less about use of data for decisionmaking and more about how data is used.

If we expect data-driven decision-making to lead to a broader vision of the policymaking process, as the authors suggest, we will need help from them in deciding how to define what “good” data-driven decisionmaking is, as well as how to build a robust information infrastructure to complement their prescription. Without this help from the authors, we risk elevating expectations about what the tools help us accomplish. And those expectations may well defeat the true promise of these tools.

GARY D. BASS

Executive Director

OMB Watch

Washington, DC


Daniel Esty and Reece Rushing’s article lays out an ambitious agenda for evidence-based regulation. Data-driven policymaking is an important way to transcend ideological squabbles and focus instead on results.

Esty and Rushing show that regulators could learn a lot from the evidence-based medicine movement. For the past 10 years, there has been an immense effort to grade and catalog the level of evidence that undergirds every treatment option. Some treatments are supported by the highest quality of evidence—multiple randomized trials—while other medical treatments are to this day based on nothing more than expert intuition. Knowing the quality of evidence gives physicians a far sounder basis to advise and treat their patients. Regulations and laws might usefully embrace a similar ranking procedure.

Preliminary randomized trials of policy are a particularly attractive policy tool. Political opponents who can’t agree on substance can sometimes agree to a procedure, a neutral test to see what works. And the results of randomized trials are hard to manipulate; often all you need to do is look at the average result for the treated and untreated groups.

For example, in 1997 Mexico began a randomized experiment called Progresa in more than 24,000 households in 506 villages. In villages randomly assigned to the Progresa program, the mothers of poor families were eligible for three years of cash grants and nutritional supplements if the children made regular visits to health clinics and attended school at least 85% of the time.

The Progresa villages almost immediately showed substantial improvements in education and health. Children from Progresa villages attended school 15% more often and were almost a centimeter taller than their non-Progresa peers. The power of these results caused Mexico in 2001 to expand the program nationwide, where it now helps more than 2 million poor families.

Progresa shows the impact of data-driven policymaking. Because of this randomized experiment, more than 30 countries around the globe now have Progresa-like contingent cash transfers.

Esty and Rushing also emphasize that the government in the future can become a provider of information. They emphasize the disclosure of raw CD-ROMs of data. But government could also crunch numbers on our behalf to make personalized predictions for citizens.

The Internal Revenue Service (IRS) and Department of Motor Vehicles (DMV) are almost universally disliked. But the DMV has tons of data on new car prices and could tell citizens which dealerships give the best deals. The IRS has even more information that could help people if only it would analyze and disseminate the results. Imagine a world where people looked to the IRS as a source for useful information. The IRS could tell a small business that it might be spending too much on advertising or tell an individual that the average taxpayer in her income bracket gave more to charity or made a larger Individual Retirement Account contribution. Heck, the IRS could probably produce fairly accurate estimates about the probability that small businesses (or even marriages) would fail.

Of course, this is all a bit Orwellian. I might not particularly want to get a note from the IRS saying my marriage is at risk. But I might at least have the option of finding out the government’s prediction. Instead of thinking of the IRS as solely a taker, we might also think of it as an information provider. We could even change its name to the “Information & Revenue Service.”

IAN AYRES

Townsend Professor

Yale Law School

New Haven, Connecticut

Ian Ayres is the author of Super Crunchers: Why Thinking-By-Numbers is the New Way to be Smart.


Here in (the other) Washington, we’ve found that citizens expect their state government to be responsive and accountable. The public wants a state government that is responsive to their needs whether that means investing in high-quality schools, ensuring public safety, or helping our economy remain strong. They also want a government that is accountable; namely, one that invests taxpayer dollars in the right priorities and in meaningful programs that achieve results.

As described in “The Promise of Data-Driven Policymaking,” new technologies and new ways of thinking about government give us an unprecedented opportunity to bring about the kind of results the public expects.

For example, data collected in Washington state in 2004 and early 2005 revealed that state social workers were responding to reports of child abuse and neglect within 24 hours only around 70% of the time. Governor Gregoire deemed this level completely inadequate and set a goal of a 90% response rate within 24 hours.

By digging further into the data, we were able to determine that there were a variety of reasons for the inadequate response time, including unfilled staff positions, misallocation of resources, and insufficient training on the database program used to record contacts with children in state care.

The data showed us what we needed to do: reallocate resources and speed up the hiring process. And the results are impressive. As of July 2007, social workers are responding to emergency cases of child abuse within 24 hours 94% of the time.

This is just one example of how our state has benefited from data-driven policymaking, and we are looking forward to many more as we further integrate this accountability mechanism into our policy decisions.

Just as businesses must innovate to stay ahead of their competition and keep their customers happy, so must government. Not only do citizens demand it, but it is also the right thing to do.

LARISA BENSON

Director, Office of Government Management, Accountability, and Performance

State of Washington

Olympia, Washington


This article deals with an important and too often neglected issue. Despite my agreement with the goals found in the article, I believe that it overreaches its scope. One can be supportive of the goal of accountability and use of information without overpromising its benefits. Solutions may actually generate new problems.

What may work in some policy areas is not effective in others. Different policy areas have different attributes (such as the level of agreement on goals, data available, and agreement on what can achieve goals). Many policy areas have competing and conflicting goals and values. Many also involve third parties (such as private-sector players) and, in the case of federal programs, intergovernmental relations with state or local governments.

This article, like too many others, tends to oversimplify data itself. There are many different types of data and information. Some are already available and useful; cause/effect relationships appear to be known, and it is relatively easy to reach for (although not always attain) objectivity. In those cases, information collected for one purpose can be useful for others. More data, however, surrounds programs in which cause/effect relationships are difficult to disentangle and fact/value separations are thorny. If data are collected from third parties, they are susceptible to gaming or outright resistance. Indeed, it is often unclear who pays for the collection of information.

Complex institutional systems make it problematic to determine who should define data systems and performance measures. Who defines them may or may not be the same institution or person who is expected to use them. In the case of the Bush administration’s Program Assessment Rating Tool, are we talking about measures that are important to the Office of Management and Budget and the White House, congressional authorizing committees, congressional appropriations committees, cabinet or subcabinet officials, executive level managers, or program managers? Each of these players has a different but legitimate perspective on a program or policy.

The technology that is currently available does hold out great promise. But that technology can only be used within the context of institutions that have limited authority and ability to respond to only a part of the problems at hand. These problems often reflect the complexity of values in our democracy, and solutions are not easily crafted on the basis of information. Indeed, multiple sources of information may make decisionmaking more, not less, difficult.

BERYL A. RADIN

Scholar in Residence

School of Public Affairs

American University

Washington, DC

Beryl A. Radin is the author of Challenging the Performance Movement: Accountability, Complexity and Democratic Values (Georgetown University Press, 2006).


Where’s the water?

If there is a flaw in David Molden, Charlotte De Fraiture, and Frank Rijsberman’s “Water Scarcity: The Food Factor” (Issues, Summer 2007) and in the seminal encyclopedic comprehensive assessment from which it is drawn, it is in the pervasive assumption that human behavior can and will change in the right direction. Given the acute and compelling nature of the problems and the overwhelming importance of the subject to every living being on Earth, there exists in these prescriptions confidence that “Surely, humans will somehow do the right thing.” Alas, sentences preceded by surely rarely describe a sure thing!

The article could as well be titled “Food Scarcity: the Water Factor.” We know already that many populations in many countries are struggling to feed themselves with currently inadequate amounts of water. We see already what declining precipitation, rising temperatures, and increased flood and drought are doing to their food production. We see in only short decades ahead the acceleration of these trends as the natural dams of glaciers and mountain snow melt and disappear.

The study is compelling, the 700strong research team awe-inspiring, the argumentation trenchant, and the solutions described neither impossible nor out of reach—if we want them to happen. For the moment, we the relatively better off can, as always, find ways to protect ourselves from this series of emerging threats and nuisances: paying more for food, buying water, building cisterns, digging further underground, and securing property where lakes and rivers are pristine. Water is indeed the divide between poverty and prosperity.

It is one of the ultimate ironies that our whole tradition of governance probably formed around the imperative to manage water: to allocate and protect supplies and tend water infrastructure. Yet the current crises of water seem too difficult, too fraught, and too entrenched in existing power relationships for most governments to be able to take on most of the issues in any meaningful way. Trends in all of these areas are going in the wrong direction. The study does not dwell enough on this. There are hopeful signs: The Australian national government is stepping in to provide the conflict resolution mechanism and fiscal backup for their largest, greatly damaged, essential river basin. A few countries are creating Ministries of Water Resources; more are beginning to write water resource plans.

Plans on paper are a good start. Translating those into action is difficult. Will we stop real estate development in dry areas? Will we stop building in floodplains? Will we really invest in optimizing existing irrigation systems?

In removing the worst environmental effects of agricultural intensification? In taking the real steps to stop overfishing? Will we continue to subsidize food, fuel, and fiber production, so that these are not grown where water availability is optimal? The article does seminal service in pointing out that many of these issues are “next-door” questions, essential to but not necessarily seen at first glance as primarily water- or food-related; often not seen as meaningful to our own lives.

We will see these issues play out silently: dry rivers, dead deltas, destocked fisheries, depleted springs and wells. We will also see famine; increased and sometimes violent competition for water, especially within states; more migration; and environmental devastation with fires, dust, and new plagues and blights.

As the world comes to a better understanding of these Earth-threatening issues and the needed directions of changes, we must do more than hope for better policy and practice—we must become advocates, involved and persuasive on behalf of rain-fed farming, for a different set of agricultural incentives and for more transparency about water use and abuse. Surely this will happen before it is indeed too late to prevent such substantial damage to ourselves, to our Earth, and to living things….?

MARGARET CARLEY-CARLSON

Chair

Global Water Partnership

Stockholm, Sweden


I entirely agree with David Molden, Charlotte De Fraiture, and Frank Rijsberman that every effort should be made to maximize income and production per unit of water. The government of India has launched for this purpose a More Income and Crop per Drop of Water movement throughout the country this year.

M. S. SWAMINATHAN

President, Pugwash Conferences on Science and World Affairs

Chairman, M. S. Swaminathan Research Foundation

Chennai, India


Better transparency for a cleaner environment

The United States was once the world forerunner in the development of pollutant release and transfer registers (PRTRs). Its Toxics Release Inventory (TRI), launched in the mid-1980s and continuously upgraded, was the first example of how information on pollutants could be made accessible to the public, and it has been the model for all national and regional PRTRs developed thereafter. The existence of and the first experiences with the TRI were also the basis for governments making commitments to “establish emission inventories” in the Rio Declaration in 1992.

Traditionally, the transparency of (environmental) information has always been one of the major assets in Western, especially Anglo-Saxon, societies. Therefore, it is astonishing that the United States has now fallen behind other countries by not requiring facility-based reporting of greenhouse gas emissions and is not following in this case the underlying “right-to-know” principle.

This shortcoming has already had international implications: The United States, contrary to 36 other countries and the European Community, did not sign the United Nations Economic Commission for Europe PRTR Protocol in 2003, a major cause being its reluctance to report greenhouse gases on a facility basis, which is asked for by the protocol.

We owe much to Elena Fagotto and Mary Graham for having clearly pointed out this gap in transparency and describing its negative impacts (“Full Disclosure: Using Transparency to Fight Climate Change,” Issues, Summer 2007). The authors do not restrict themselves to analyzing the situation but make pragmatic proposals for how to carefully construct a transparency system as a politically feasible first step.

Despite the advantages of more transparency, even with regard to emission reductions, priority efforts should be given to directly reducing greenhouse gas emissions; for example, by implementing a cap-and trade approach as soon as possible.

BERND MEHLHORN

German Ministry for the Environment, Nature Conservation, and Nuclear Safety

Bonn, Germany


Science’s social effects

As with many policies, fulfilling their intent is a matter of enforcement. The National Science Foundation (NSF), with its decentralized directorate/division/program structure, supports the “broader impacts” criterion unevenly at best. This criterion can be traced to NSF’s congressional mandate (the Science and Engineering Equal Opportunities Act of 1980, last amended in December 2002) to increase the participation of underrepresented groups (women, minorities, and persons with disabilities) in STEM (science, technology, engineering, and mathematics). The problem of enforcement resides in the collusion of program officers and reviewers to value participation in STEM and the integration of research and education to transform academic institutions, but not to fund them. As Robert Frodeman and J. Britt Holbrook observe in “Science’s Social Effects” (Issues, Spring 2007), the two criteria are not weighted equally. Broader impacts are unlikely to overshadow intellectual merit in deciding the fate of a proposal, nor arguably should they. And because proposal submission is an independent event, accountability for project promises of broader impacts is never, except for the filing of a final report, systematically considered in the proposer’s next submission. Consequently, the gap between words (commitments in a proposal) and deeds (work performed under the project) continues.

So what to do about it? In an age of overprofessionalization,“education and public outreach (EPO) professionals,” as Frodeman and Holbrook call them, join education evaluators as plug-in experts invoked to reassure reviewers that proposals have covered all bases. Yet these are viewed as add-ons to the “real intellectual work” of the proposed project rather than weighted as “plus factors.”And it is doubtful that “researchers on science,” who collectively are as single-minded and professionally hidebound as the science and engineering communities they seek to analyze, can help. Their criticisms remain at the margins, largely unactionable if not unintelligible. They are also not inclined and are ill-equipped to have the conversation with those they could inform. Most, I suspect, are themselves devising ways of satisfying the broader impacts criterion, much like their natural science brethren, to survive merit review without devoting much project time or money to “social effects.” Most cynically, one could say that these are rational responses to increasing sponsor demands for performance and accountability.

If an NSF program, however, were treated as a true portfolio of activities, including some that pursue broader impacts, then funded projects would be expected to demonstrate social relevance as a desired outcome. It is unrealistic to demand that every NSF principal investigator be responsible in every project for fulfilling the need to educate, communicate, and/or have effect beyond their immediate research community. Diversifying review panels with specialists who can address broader impacts, in addition to the small minority of panelist-scientists who “get it,” would be a better implementation strategy, providing a kind of professional development for other panelists while applying appropriate scrutiny to the proposed work they are asked to judge.

All of this puts program officers, who already exercise considerable discretion in selecting ad hoc mail and panel reviewers, on the spot. Make them accountable for their grantees’ serious engagement of the broader impacts criterion. If they don’t deliver, their program’s funding should suffer. That would distribute the burden to division directors and directorate heads. Without such vertical accountability practiced by the sponsor, what we have is all hand-waving, wishful thinking, and a kind of shell game: Beat the sponsor by either feigning or farming out responsibility instead of proposing how the project will broaden participation, enhance infrastructure, or advance technological understanding.

Frodeman and Holbrook have diagnosed a need. Although I applaud their pragmatic bent, I fear their solution hinges on misplaced trust in rational action and a commitment to promoting science’s social effects by a recalcitrant science community. Trust, but verify.

DARYL E. CHUBIN

Director, Center for Advancing Science and Engineering Capacity

American Association for the Advancement of Science

Washington, DC


Universities as innovators

“…a hitter should be measured by his success in that which he is trying to do …create runs. It is startling …how much confusion there is about this. I find it remarkable that, in listing offenses, the league will list first— meaning best—not the team which scored the most runs, but the team with the highest batting average. It should be obvious that the purpose of an offense is not to compile a high batting average.” Bill James, Baseball Abstract, 1979.

In his book Moneyball, Michael Lewis laid out the new knowledge in baseball that was guiding seemingly mediocre teams with small budgets to new heights of success. The key is knowing which metrics are related to winning. Although it sounds simple, it requires ignoring decades of conventional wisdom spouted by baseball announcers and armchair managers.

In “The University As Innovator: Bumps in the Road,” (Issues, Summer 2007) Robert E. Litan, Lesa Mitchell, and E. J. Reedy make a similar observation that “scoring runs” in transferring new ideas and innovations from universities to the marketplace has taken a back seat to a “high batting average” measured by revenues per deal. By using the wrong metric, university tech transfer offices are turning the Bayh-Dole Act on its head. The authors point out that the act envisioned accelerating the introduction of innovations into the marketplace by clarifying the intellectual property rules and giving universities and their faculties an incentive to commercialize their discoveries. Instead, universities are focusing on ownership to the detriment of innovation.

This misguided focus on revenue enhancement, when moving ideas out of universities, is matched by an unseemly focus on maximizing revenues when bringing students in. In his book The Price of Admission, Daniel Golden details how top universities pass over better-qualified students in favor of the children of the wealthy, with the knowledge that it will help development. By choking talent on the way in and choking ideas on the way out, universities are not just inefficient, they are violating their educational duty to students and their duty to serve the public interest.

The authors’ solutions to this problem range from market-driven to dreamy. The “free-agency” model builds on a simple idea: Let innovators build their own social networks to develop their inventions rather than forcing them to squeeze through a central chokepoint populated by people who are risk-averse. Regional alliances and Internet-based approaches are variations on the social networking theme and should be included in the commercialization repertoire.

On the dreamy end is the “grateful faculty” approach. This may work at the top end for the biggest successes where shame is a motivator, but loyalty to institutions with 40% overhead rates, rigged admissions processes, and irritating tech transfer offices is not likely to be characteristic of your average innovator.

Measuring the right things—number of innovations licensed versus revenue scored, meritorious students versus family wealth—will help universities score runs. Without the right metrics, we will be on a losing team no matter what our batting average.

GREG SIMON

President

FasterCures: The Center for Accelerating Medical Solutions

Washington, DC

Risky business

There are three classes of disasters, distinguished by their cause: deliberately initiated disasters, such as the 9/11 attacks; natural disasters, such as Hurricane Katrina in 2005; and industrial disasters, such as the Northeast blackout in 2003 or the train wreck and fire in the Baltimore tunnel in 2001. Humans intentionally cause the first and by mistakes in design or management cause the third. We blame nature for natural disasters; however, if disasters are assessed by their consequences, not their causes, the death and damage from all three kinds of catastrophes actually owe their severity to a range of human actions or failures to act.

Unhappily, the consequences of all kinds of disasters are growing in severity. Who is to blame, and what should be done to reduce the consequent vulnerability of Americans to catastrophe?
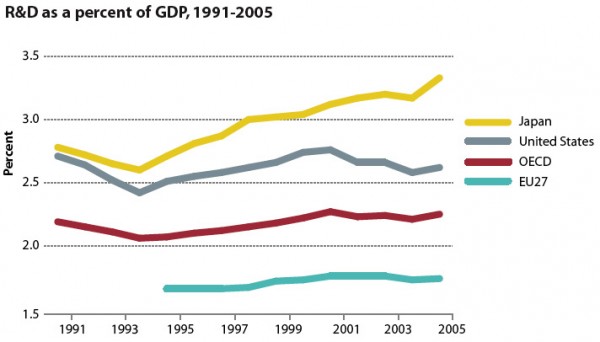
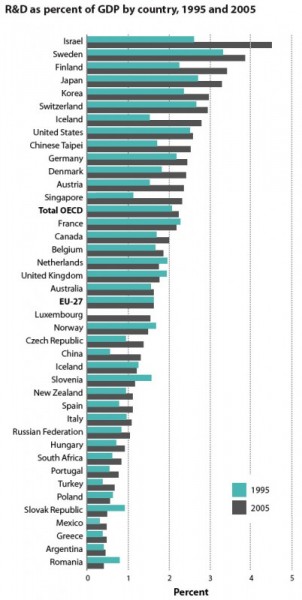
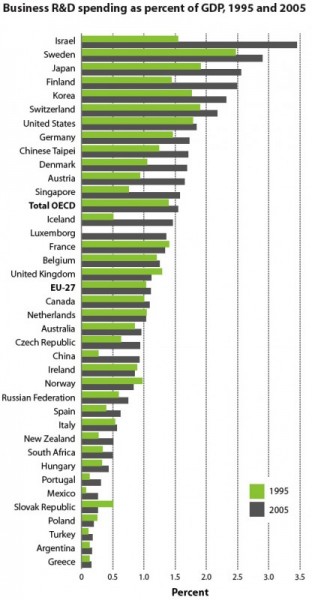
Companies that deliver critical infrastructure services and government officials at all levels are jointly responsible for reducing the level of vulnerability to disaster. Although the private and public sectors place very different priorities on the relative importance of the three kinds of hazards, they nonetheless focus most of their attention on response to and recovery from disaster. By contrast, Charles Perrow, a prolific author on the subject of disasters and an emeritus professor of sociology at Yale, sensibly emphasizes in The Next Catastrophe that only a strategy of reducing vulnerability to major catastrophes in the first place has any hope of substantial mitigation of consequences.

Whereas government, especially at the federal level, considers terrorism its top priority, Perrow correctly considers natural and industrial disasters to be the top priority, on two grounds: First, they are much more likely, and second, the most effective strategies for reducing vulnerability to natural and industrial disasters will, with some exceptions such as a terrorist nuclear weapon, also serve to mitigate a terror attack as well.

Perrow does not have good news for us. He describes his book as about “the inevitable inadequacy of our efforts to protect us from major disasters.” The record of failure tells us, he says, that “we cannot expect much from our organizations,” public or private. From his detailed retelling of the stories of dozens of disasters in the United States, he concludes that most could have been avoided, or the consequences greatly reduced, if only organizations had performed well, executives had the right priorities, and governments were more strenuous in their regulations. But alas, he concludes that “prevention and mitigation will always fall short, sometimes alarmingly so, and we should begin to reduce the size of our vulnerable targets.”

After reciting one case after another in which government failed to regulate or firms failed to reduce vulnerabilities, he argues that much of our increased vulnerability to disaster results from the growing centralization of power and operations in key industry sectors. As private firms, aided by government deregulation, have increasingly aggregated their activities in the quest for greater economies of scale, resilience in the overall system has been weakened. In addition to the cases he discusses, there are other extreme examples that could be cited: a cruise ship being built for 6,400 passengers and a chicken-packing plant that ships 14.3 million chickens a week to our supermarkets.

Perrow would reverse the centralization trend, saying that the goal of regulation must be “to prevent the aggregation of power in private hands.” He would like a stronger government, a more centralized regulatory system, and more fragmented and dispersed operations by firms engaged in critical infrastructure. He is realistic enough politically, however, to recognize that this solution is a pipe dream. Thus, his recommended strategy is to “reduce the size of the targets, and thus minimize the extent of harm these disasters can do.” Yet if executives have contrary priorities, organizations often perform poorly, and government fails to regulate more vigorously, even this objective will remain a mirage on the desert of political economy.

An equally elusive challenge, in Perrow’s long list of daunting challenges for reducing the size of the target, is reversing the growing concentration of population in the more vulnerable parts of the country. But he offers little hope for how this might be achieved without citizens already in these cities exerting effective political opposition to the real estate developers and others with a vested interest in growth at whatever cost to resilience.

The Bush administration takes the view that market forces should be adequate to induce the executives of critical infrastructure firms to make the large investments needed to restructure in ways that reduce vulnerability. But this is a false hope without an understanding with government on how a level playing field for competition in an industry can be maintained. In the case of terrorist threats, firms can evaluate their vulnerability but cannot be expected to evaluate the risk of an attack without the intelligence information, to which they do not have access. Firms also tend to regard the terrorist threat as largely the government’s problem, and the government’s use of the term “war on terror” only tends to emphasize this judgment.

Industrial hazards, on the other hand, can threaten a firm’s revenue and even its ability to stay in business. Minimizing the likelihood of such disasters is a high priority, at least in well-run firms. But threats of more centralized and vigorous regulation intended to restructure whole industries are unlikely to create an environment in which firms will seek a collaborative approach with government. In addition, the federal government’s priorities are counterterrorism and the most cataclysmic natural disasters. To the extent that the federal government believes it has any responsibility for reducing industrial disasters and has regulatory power to attempt it, that authority is exercised through a wide variety of agencies. Most of these agencies regulate competition and prices, not resilience in the face of unlikely disasters. There is little coherence of regulatory policy or recognition of the interdependence of regulated services.

There is, however, one path to making at least some progress toward vulnerability reduction in our society: a serious effort to bridge the gulf of mistrust between government and industry. Senior executives of firms providing critical infrastructure services are vocal, at least in private, about the lack of shared information, of longer-term understanding about the relative roles of the public and private sectors, and indeed about a profound lack of trust between them.

Better appreciation by government agencies of the incentives as well as the constraints of market forces in resilience investment decisions by firms will pay off not only in better national security but in a stronger economy in the future. For with resilience increasingly tied to globally networked enterprises, to global supply chains, and to outsourcing of critical infrastructure services, business incentives for increased resilience will continue to grow. Globalization of the world economy is a powerful driver of business strategy and is increasingly a source of threats to the continuity of business services. Government must, therefore, work with the private sector to find ways to ensure a balance among corporate efficiency, resilience, and vulnerability to disasters. This line of endeavor is not only essential to achieving Perrow’s goal, but it is also less dependent on a strong political swing to the left, which remains Perrow’s best hope.

The Global Tour of Innovation Policy: Introduction

Innovation does not take place in a laboratory.

It occurs in a complex web of activities that transpire in board rooms and court rooms, in universities and coffee shops, on Wall St. and on Main St., and it is propelled by history, culture, and national aspirations. Innovation must be understood as an ecosystem. In the natural world life might begin from a tiny cell, but to grow and prosper into a mature organism, that cell needs to be supported, nurtured, and protected in a variety of ways. Likewise, the germ for an innovation can appear anywhere, but it will mature into a real innovation only if it can grow in a supportive social ecosystem.

The idea of an innovation ecosystem builds on the concept of a National Innovation System (NIS) popularized by Columbia University economist Richard Nelson, who describes an NIS as “a set of institutions whose interactions determine the innovative performance… of national firms.” Too often, unfortunately, analysts and policymakers perceive the NIS as the immutable outcome of large historical and cultural forces. And although there is no doubt that these large forces powerfully shape an NIS, many aspects of an NIS can be recast with deliberate action.

Among the essential components of an NIS are social norms and value systems, especially those concerning attitudes toward failure, social mobility, and entrepreneurship, and these cannot be changed quickly or easily—but they can change. Other critical components are clearly conscious human creations and are obviously subject to change; these include rules that protect intellectual property and the regulations and incentives that structure capital, labor, financial, and consumer markets. Public policy can improve innovation-led growth by strengthening links within the system. Intermediating institutions, such as public-private partnerships, can play a key role in this regard by aligning the actions of key players in the system such as universities, laboratories, and large companies, in conjunction with the self-interest of venture capitalists, entrepreneurs, and other participants with national objectives. Some systems underemphasize the role of the public sector in providing R&D funds and support for commercialization activities; other systems sometimes overlook the framework conditions required to encourage risk, mitigate failure, and reward success.

Paradoxically, international cooperation is a hallmark of scientific progress, technology development, and the production of final goods. At the same time, there is fierce international competition for the growth industries of the future with the jobs, new opportunities, and synergies that high-tech industries bring to a national economy. In the past, many nations believed that their innovation systems were largely immutable, reflecting distinct national traditions. The winds of globalization have changed that perspective. The articles that follow describe the efforts of a handful of nations to deliberately shape their NIS. They are all works in progress that illustrate that there is no perfect innovation ecosystem. Each country is struggling to determine what can be changed and what must be accommodated in its particular circumstances. What works in one context will not necessarily work in another. What works in one decade will not necessarily work in the next. And with the global economic systems always in flux, every country must be ready to reexamine and revise its policies. These articles contain no easy answers. They offer something much more useful: candid and perceptive discussion of the successes and failures that are slowly leading all of us to a better understanding of how innovation can be tapped and directed to achieve human goals.

This collection of articles is an outgrowth of the Board on Science, Technology, and Economic Policy’s project on Comparative Innovation Policy: Best Practice for the 21st Century, which is an effort to better understand what leading countries and regions around the world are doing to enhance the operation of their innovation systems. The project’s publications include Innovation Policies for the 21st Century; India’s Changing Innovation System: Achievements, Challenges, and Opportunities for Cooperation; Innovative Flanders: Synergies in Regional and National Innovation Policies in the Global Economy; and Creating 21st Century Innovation Systems in Japan and the United States: Lessons from a Decade of Change.

Global trends in R&D Spending

Several years of economic growth have benefited investment in science, technology, and innovation. Business investment has increased and consumer spending has rebounded. This has increased demand for innovative products, processes, and services, and with it demand for scientific and technical knowledge. Improved corporate profitability has paved the way for growing investment in intellectual assets, including research and development (R&D), human resources, and intellectual property.

Increased spending is found in most of the 30 member countries of the Organization for Economic Cooperation and Development (OECD), including the major industrialized countries of Europe, Japan, and the United States. Non-OECD economies are making a growing contribution to global R&D expenditure. The combined R&D expenditure of China, Israel, Russia, and South Africa was equivalent to almost 22% of that of OECD countries in 2005, up from 9% in 1995, and these countries attract a growing share of investment by foreign affiliates. Recent policy initiatives aim to enhance the attractiveness of these countries to foreign investment by improving their domestic innovation capabilities.

Growing R&D intensity

Total R&D spending in the OECD countries reached $772 billion in 2005, about 2.25% of GDP. R&D intensity reached 3.33% of GDP in Japan, and 2.62% in the United States in 2005. R&D intensity was lower in Europe, where only a few countries are on track to meet the European Union R&D target of 3% of GDP. Although Europe’s lower R&D intensity is partly linked to cyclical conditions, it is primarily due to structural factors, such as the small size of its information technology, manufacturing, and services sectors.

Sources: Data in these graphs come from OECD’s; Science, Technology, and Industry Outlook, 2006; Main Science and Technology Indicators, 2007–I; and the ANBERD Database, 2007.

Growing share of the global economy

The richer countries are increasing their R&D intensity faster than are their less-affluent neighbors within the OECD. The largest gains were in Japan, Iceland, Finland, Denmark, Austria, and Sweden. Poland and the Slovak Republic saw declines. R&D intensities also grew in many non-OECD economies. Israel, Chinese Taipei, and Singapore, at 4.5, 2.5, and 2.4%, respectively, exceed the OECD average. Some major low-intensity countries such as Russian and China have increased spending quickly and are poised to continue.

Sources: Data in these graphs come from OECD’s; Science, Technology, and Industry Outlook, 2006; Main Science and Technology Indicators, 2007–I; and the ANBERD Database, 2007.

Business investment mixed

Business enterprises account for the bulk of R&D performed in OECD countries, and much of that R&D is financed by industry itself. Hence, as industry investments in R&D slowed in recent years, business-performed R&D stagnated also, mainly owing to slow growth in the United States and Europe. Exceptions where growth has been strong include Finland, Iceland, Denmark, Austria, Korea, and Japan.

Sources: Data in these graphs come from OECD’s; Science, Technology, and Industry Outlook, 2006; Main Science and Technology Indicators, 2007–I; and the ANBERD Database, 2007.

Government steps up

After falling as a percentage of GDP in the late 1990s, government budget appropriations or outlays for R&D (GBAORD) climbed 7% a year in the OECD area between 2000 and 2005, from $197 billion to $276 billion and from 0.63% to 0.67% of GDP. Largest percentage increases were in Luxembourg, Ireland, Spain, and Korea. The percentage fell slightly in Japan.

Sources: Data in these graphs come from OECD’s; Science, Technology, and Industry Outlook, 2006; Main Science and Technology Indicators, 2007–I; and the ANBERD Database, 2007.

Service sector on the rise

Between 1995 and 2004, services sector R&D grew at an annual rate of 10.5%, compared to 4.6% for manufacturing. Services now make up one-quarter of total business R&D in the OECD, and more than one-third in Australia, Denmark, the United States, Canada, the Czech Republic, and Norway. Recent innovation surveys indicate that the share of innovative firms in some service industries—financial intermediation and business services in particular—exceeds that of manufacturing.

Sources: Data in these graphs come from OECD’s; Science, Technology, and Industry Outlook, 2006; Main Science and Technology Indicators, 2007–I; and the ANBERD Database, 2007.

The flattening globe

In most OECD countries, the share of R&D performed by foreign affiliates has increased as multinational enterprises have acquired foreign firms and established new R&D facilities outside their home country. Almost 16% of business R&D in the OECD area was performed in foreign affiliates in 2004, up from 12% in 1995. Most R&D by foreign affiliates remains within OECD countries, but the regions of fastest growth lie outside the OECD area, in particular in Asia.

Sources: Data in these graphs come from OECD’s; Science, Technology, and Industry Outlook, 2006; Main Science and Technology Indicators, 2007–I; and the ANBERD Database, 2007.

Ethanol: Train Wreck Ahead?

The new vogue in energy policy is plant-derived alternative fuels. Corn-based ethanol, and to a lesser extent oilseed-based biodiesel, have emerged from the margins to take center stage. However, although ethanol and biodiesel will surely play a role in our energy future, the rush to embrace them has overlooked numerous obstacles and untoward implications that merit careful assessment. The current policy bias toward corn-based ethanol has driven a run-up in the prices of staple foods in the United States and around the world, with particularly hurtful consequences for poor consumers in developing countries. U.S. ethanol policies rig the market against alternatives based on the conversion of cellulosic inputs such as switchgrass and wood fibers. Moreover, the environmental consequences of corn-based ethanol are far from benign, and indeed are negative in a number of important respects. Given the tremendous growth in the corn-based ethanol market, it should no longer be considered an infant industry deserving of tax breaks, tariff protection, and mandates.

In place of current approaches, we propose initiatives that would cool the overheated market and encourage more diversified investment in cellulosic alternatives and energy conservation. First, we would freeze current mandates for renewable fuels to reduce overinvestment in and overreliance on corn-based ethanol. Second, we would replace current ethanol tax breaks with a sliding scale that would reduce incentives to produce ethanol when corn prices are high and thus slow the diversion of corn from food to fuel. Third, we would implement a wide-ranging set of federal fees and rebates that discourage energy consumption and encourage conservation. Fourth, we would shift federal investment in cellulosic alternatives from subsidies for inefficient production facilities and direct them instead to upstream investment in R&D to improve conversion technologies. Together, these four changes would still retain a key role for biofuels in our energy future, while eliminating many of the distortions that current policy has created.

Infant industry no more

Since 1974, when the first federal legislation to promote corn-based ethanol as a fuel was approved, ethanol has been considered an infant industry and provided with increasingly generous government subsidies and mandates. Ethanol’s first big boost came in the late 1970s in response to rising oil prices and abundant corn surpluses. A tax credit for blending corn-based ethanol with gasoline created a reliable market for excess corn production, which was seen as an alternative to uncertain export markets.

But the real momentum for ethanol resulted from environmental concerns about the use of lead to boost the octane rating of gasoline. The phase-out of lead as an additive began in 1973, and ethanol replaced it as a cleaner-burning octane enhancer. In recent years, it has replaced the oxygen additive MTBE, which was phased out because of concerns about groundwater pollution. Ethanol’s increasing value as a gasoline additive has allowed it to receive a premium price, and by 2005 corn-based ethanol production in the United States reached 3.9 billion gallons.

More recently, increases in oil prices during the past two years brought ethanol into national prominence. From $52 a barrel in November 2005 to more than $70 in mid-2007, higher oil prices coincided at first with cheap corn: a prescription for supernormal ethanol profits. Investment in new capacity took off, and 2006 production topped 5 billion gallons.

Although high oil prices have given ethanol the headroom it needs to compete, the industry is built on federal subsidies to both the corn farmer and the ethanol producer. Direct corn subsidies equaled $8.9 billion in 2005, but fell in 2006 and 2007 as high ethanol-driven corn prices reduced subsidy payments. These payments may soon be dwarfed by transfers to ethanol producers resulting from production mandates, tax credits, grants, and government loans under 2005 energy legislation and U.S. farm policy. In addition to a federal ethanol tax allowance of 51 cents per gallon, many states provide additional subsidies or have imposed their own mandates.

In the 2005 energy bill, Congress mandated the use of 7.5 billion gallons of biofuels by 2012, and there is strong political support for raising the mandate much higher. President Bush, in his January 2007 State of the Union speech, called for increasing renewable fuel production to 35 billion gallons by 2017. Such an amount, if it were all corn-derived ethanol, would require about 108% of total current U.S. corn production.

In addition to providing domestic subsidies, Congress has also shielded U.S. producers from foreign competition. Brazil currently produces about as much ethanol as the United States (most of its derived from sugarcane instead of corn) at a significantly lower cost, but the United States imposes a 54-cent-a-gallon tariff on imported ethanol.

Negative effects

As the ethanol industry has spiked, a larger and larger share of the U.S. corn crop has gone to feed the huge mills that produce it. According to the Renewable Fuels Association, there were 110 U.S. ethanol refineries in operation at the end of 2006, another 73 were under construction, and many existing plants were being expanded. When completed, this ethanol capacity will reach an estimated 11.4 billion gallons per year by the end of 2008, requiring 35% of the total U.S. corn crop even with a good harvest. More alarming estimates predict that ethanol plants could consume up to half of domestic corn supplies within a few years. Yet, from the standpoint of energy independence, even if the entire U.S. corn crop were used to make ethanol, it would displace less gasoline usage than raising fleet fuel economy five miles per gallon, readily achievable with existing technologies.

As biofuels increasingly impinge on the supply of corn, and as soybeans and other crops are sacrificed to grow still more corn, a food-versus-fuel debate has broken out. Critics note that domestic and international consumers of livestock fed with grains face steadily rising prices. In July 2007, the Organization for Economic Cooperation and Development issued an outlook for 2007–2016, saying that biofuels had introduced global structural shifts in food markets that would raise food costs during the next 10 years. Especially for the 2.7 billion people in the world living on the equivalent of less than $2 per day and the 1.1 billion surviving on less than $1, even marginal increases in the cost of staple grains can be devastating. Put starkly: Filling the 25-gallon tank of a sport utility vehicle with pure ethanol would require more than 450 pounds of corn, enough calories to feed one poor person for a year.

The enormous volume of corn required by the ethanol industry is sending shock waves through the food system. The United States accounts for some 40% of the world’s total corn production and ships on average more than half of all corn exports. In June 2007, corn futures rose to over $4.25 a bushel, the highest level in a decade. Like corn, wheat and rice prices have surged to 10-year highs, encouraging farmers to plant more acres of corn and fewer acres of other crops, especially soybeans. The proponents of corn-based ethanol argue that yields and acreage can increase to satisfy the rising demand. However, U.S. corn yields have been trending upward by a little less than 2% annually during the past 10 years. Even a doubling of yield gains would not be enough to meet current increases in demand. If substantial additional acres are to be planted with corn, the land will have to be pulled from other crops and the Conservation Reserve Program, as well as other environmentally fragile areas.

BRUCE BABCOCK, IN A STUDY FOR THE CENTER FOR AGRICULTURAL AND RURAL DEVELOPMENT AT IOWA STATE UNIVERSITY, PREDICTED IN JUNE 2007 THAT ETHANOL’S IMPACT ON CORN PRICES COULD MAKE CORN ETHANOL ITSELF UNPROFITABLE BY 2008.

In the United States, the explosive growth of the biofuels sector and its demand for raw stocks of plants has triggered run-ups in the prices not only of corn, other grains, and oilseeds, but also of crops and products less visible to analysts and policymakers. In Minnesota, land diverted to corn to feed the ethanol maw is reducing the acreage planted to a wide range of other crops, especially soybeans. Food processors with contracts with farmers to grow crops such as peas and sweet corn have been forced to pay higher prices to keep their supplies secure. Eventually, these costs will appear in the prices of frozen and canned vegetables. Rising feed prices are also hitting the livestock and poultry industries. Some agricultural economists predict that Iowa’s pork producers will be driven out of business as they are forced to compete with ethanol producers for corn.

It is in the rest of the world, however, where biofuels may have their most untoward and devastating effects. The evidence of these effects is already clear in Mexico. In January 2007, in part because of the rise in U.S. corn prices from $2.80 to $4.20 in less than four months, the price of tortilla flour in some parts of Mexico rose sharply. The connection was that 80% of Mexico’s corn imports, which account for a quarter of its consumption, are from the United States, and U.S. corn prices had risen, largely because of surges in demand to make ethanol. About half of Mexico’s 107 million people live in poverty; for them, tortillas are the main source of calories. By December 2006, the price of tortillas had doubled in a few months to eight pesos ($0.75) or more per kilogram. Most tortillas are made from homegrown white corn. However, industrial users of imported yellow corn in Mexico (for animal feed and processed foods) shifted to using white corn rather than imported yellow, because of the latter’s sharp price increase. The price increase of tortillas was exacerbated by speculation and hoarding. In January 2007, public outcry forced Mexico’s new President, Felipe Calderón, to set limits on the price of corn products.

The International Food Policy Research Institute (IFPRI), in Washington, DC, has monitored the run-up in the demand for biofuels and provides some sobering estimates of their potential global impact. IFPRI’s Mark Rosegrant and his colleagues estimated the displacement of gasoline and diesel by biofuels and its effect on agricultural market prices. Given rapid increases in current rates of biofuels production with existing technologies in the United States, the European Union, and Brazil, and continued high oil prices, global corn prices are projected to be pushed upward by biofuels by 20% by 2010 and 41% by 2020. As more farmers substitute corn for other commodities, prices of oilseeds, including soybeans, rapeseed, and sunflower seed, are projected to rise 26% by 2010 and 76% by 2020. Wheat prices rise 11% by 2010 and 30% by 2020. Finally, and significantly for the poorest parts of sub-Saharan Africa, Asia, and Latin America where it is a staple, cassava prices rise 33% by 2010 and 135% by 2020.

Is ethanol competitive?

Although there are possible alternatives to corn and soybeans as feedstocks for ethanol and biodiesel, these two crops are likely, in the United States at least, to remain the primary inputs for many years. Politics will play a major role in keeping corn and soybeans at center stage. Cellulosic feedstocks are still more than twice as expensive to convert to ethanol as is corn, although they use far fewer energy resources to grow. And corn and soybean growers and ethanol producers have not lavished 35 years of attention and campaign contributions on Congress and presidents to give the store away to grass.

Yet because of the panoply of tax breaks and mandates lavished on the industry, the competitive position of the biofuels industry has never been tested. Today, however, the pressures and distortions it has created encourage perverse incentives: For ethanol to profit, either oil prices must remain high, further draining U.S. foreign exchange for petroleum imports, or corn prices must come off their market highs, allowing reasonable margins in the corn ethanol business. But high oil prices are what allow ethanol producers to pay a premium for corn. Hence, oil and corn prices are ratcheting up together, heedless of the effects on consumers and inflation. Bruce Babcock, in a study for the Center for Agricultural and Rural Development at Iowa State University, predicted in June 2007 that ethanol’s impact on corn prices could make corn ethanol itself unprofitable by 2008.

TO THE EXTENT THAT ETHANOL CREATES SHORTAGES AND DIVERTS CORN FROM FOOD AND FEED TO FUEL USES, IT WILL BECOME INCREASINGLY CONTROVERSIAL AND POLITICALLY VULNERABLE, AS WILL THE TARIFF WALLS ERECTED TO KEEP CHEAPER BRAZILIAN ETHANOL OUT OF THE U.S. MARKET.

Apart from ethanol-specific subsidies, tax breaks, and mandates, it is also important to recall that the ethanol market has been made in large part by shifts in U.S. transportation and clean air policies. When these policies are considered, it is clear that ethanol is not really competitive with petroleum, but has served instead as its complement. As increased production capacity allows ethanol to move beyond its traditional role as a gasoline enhancer (now a roughly 6-billion-gallon market) and become a gasoline replacement, several major concerns have arisen.

One critical factor involves a key ethanol liability: its energy content. Because it will drive a car only two-thirds as far as gasoline, its value as a gasoline replacement (rather than a gasoline additive) will probably gravitate toward two-thirds of gasoline’s price. A lower ethanol price would then lower the breakeven price that ethanol producers could pay for corn. Meanwhile, the domestic market for corn has been transformed from chronic surplus stocks and carry-forwards into bare shelves. Tighter supplies have led to higher prices, even in good-weather years. And what if dry hot weather produces a short corn crop? A 2007 report for the U.S. Department of Agriculture by Iowa State’s Center for Agricultural and Rural Development estimated that with a 2012 mandate of 14.7 billion gallons, corn prices would be driven 42% higher and soybean prices 22% higher by a short crop similar to that of 1988. Corn exports, meanwhile, would tumble 60%. In short, ethanol is switching from a demand-builder to a demand-diverter.

Another factor involves energy efficiency. If net energy efficiency is thought of as a dimension of competitiveness, a recent Argonne National Laboratory ethanol study summarized by the U.S. Department of Energy is revealing. It showed that ethanol on average uses 0.74 million BTUs of fossil energy for each 1 million BTUs of ethanol delivered to the pump. In addition, the total energy used to produce corn-based ethanol, including the solar energy captured by photosynthesis, is 1.5 to 2 million BTUs for each 1 million BTUs of ethanol delivered to a pump. If corn for ethanol is just an additional user of land, it is fair to ignore the “free” solar energy that grows the corn. But if corn-based ethanol is diverting solar energy from food or feed to fuel through subsidies or mandates, policymakers cannot so easily ignore it. Similarly, because ethanol has only two-thirds the energy content of gasoline, its greenhouse gas emissions per mile traveled (rather than per gallon) are comparable to those of conventional gasoline.

Yet another concern is the net environmental effect of ethanol. It takes from one to three gallons of water to produce a gallon of ethanol, which raises concerns about ground and surface water supplies. Although ethanol has some advantages over conventional gasoline in terms of its contribution to air pollution, it also has some disadvantages. One is its higher volatile organic compounds (VOCs) emissions, which contribute to ozone formation. Ethanol also increases concentration of acetaldehyde, which is a carcinogen. In addition, corn and soybeans are row crops that encourage the runoff of fertilizers and pesticides into streams, rivers, and lakes. As acres come out of soybeans and into corn (of the 12 million acres of new corn planted in 2007, three-fourths came out of soybeans), they require more nitrogen fertilizer. This nitrogen runs off into waters, encouraging algae blooms that choke off oxygen for fish and other creatures. All of the above belie ethanol’s reputation as “greener” than gasoline.

Finally, the logic behind the renewable fuels standard is that the raw material used—such as corn for ethanol—is renewable. Corn is renewable in the sense that it is harvested annually. But corn production and processing consume fossil fuels. So what is the net renewable benefit? Most estimates place the net renewable energy contribution from corn-based ethanol at 25% to 35%. Using a midpoint of 30%, that means that a mandate of 7.5 billion gallons, if filled by corn-based ethanol, yields a net renewable energy gain of only 2.25 billion gallons. Other products or processes may be more cost-effective in replacing gasoline.

As these problems become clearer, so does the appeal of cellulose as the feedstock for ethanol. The best role for corn-based ethanol then becomes simply building a bridge to the more promising world of cellulosic ethanol. But it is not clear why building a corn-based ethanol industry much beyond its current size as a producer of a gasoline additive makes sense as a prelude to cellulosic ethanol, for a number of reasons, First, technological progress in producing corn-based ethanol is not likely to be relevant to the technology challenges facing cellulosic ethanol. Second, growing areas for cellulose may well be different than for corn; if switchgrass is to be grown on current corn acres, it will have to beat high current corn prices in profitability. Third, the low energy density of cellulosic materials suggests that the handling and processing infrastructure they need is likely to be different in scale than for corn-based ethanol. Fourth, the economics of cellulosic ethanol are currently very high cost, with many other petroleum substitutes likely to be attractive before cellulosic ethanol. Finally, land-use conflicts—between food/feed and fuel or between conservation and fuel—differ in degree, not kind, between corn and cellulose and are likely to constrain a cellulosic industry’s capacity to well below the 35 billion gallons called for by President Bush. And whatever plant material is used to make biofuels, an estimate in the August 17, 2007 issue of Science suggested that substituting just 10% of U.S. fuel needs with biofuels would require 43% of U.S. cropland.

In short, there is enough uncertainty about ethanol’s supply and demand prospects to argue for a pause in the headlong rush into ethanol production. Turning corn surpluses into a gasoline additive was a strategy that made food and fuel complementary. But turning a tightening corn market into a less rewarding gasoline-replacement strategy heightens the conflict between food and fuel uses, with major environmental externalities and limited environmental benefits.

Fundamental change needed

If we are to avoid a situation in which ethanol becomes a demand diverter for corn, a fundamental reorientation in farm and energy policies is required. The alternative policy model will require replacing the mandates, subsidies, and tariffs designed to help an infant industry with a new set of policy instruments intended to broaden the portfolio of energy alternatives and to create market-driven growth in renewable energy demand.

Today, politicians compete with one another to raise the biofuels mandate. Little apparent consideration is given to the potential consequences of building markets on political fiat rather than sound finances. The result is that capacity is built too fast, at uneconomic scale, and in the wrong locations. Competing interests such as domestic feeders and foreign consumers can get trampled in the process, especially during a short crop, when the mandate functions as an embargo on other uses. Eventually, competing suppliers take over the traditional markets imperiled by ill-considered mandates. As this scenario unfolds, the burden of false economics and competitive responses may become too much to bear, and the shaky superstructure will crash, stranding assets and bankrupting many. In order to avoid such a crash, the United States should not increase the biofuels mandate beyond the current level of 7.5 billion gallons.

Next, consider subsidies to ethanol. The blender’s tax credit of 51 cents per gallon enabled ethanol to compete with gasoline in a market characterized by low gasoline prices and surplus corn supplies. That market no longer exists. Gasoline prices have skyrocketed because of high petroleum prices. The fixed per-gallon subsidy generated high profit margins for ethanol producers, which led to excessive growth in production. Some suggest correcting for this effect by replacing the fixed subsidy with a variable one that would decline as oil prices rose. This approach essentially would link ethanol to the volatile petroleum market.

Linking to the demand side of the equation, however, may not be the best avenue for reconciling food and fuel uses. We should consider the subsidy’s effect on the supply side of the equation. To the extent that an ethanol subsidy reduces surpluses, it is likely to enjoy continued and significant political support. But if it creates shortages and diverts corn from food and feed to fuel uses, it will become increasingly controversial and politically vulnerable, as will the tariff walls erected to keep cheaper Brazilian ethanol out of the U.S. market.

For these reasons, we should replace today’s fixed subsidy policy with a variable subsidy linked to corn supplies. As corn prices rise, the subsidy should be phased down. This would provide an incentive to convert corn to energy when supplies are ample, while allowing food and feed (and other industrial) uses to compete on an equal footing as supplies tighten and prices rise. When corn prices rise above some set level, the subsidy would fall to zero. At the same time, we should lower the tariff on imported ethanol.

An approach to ethanol incentives along these lines has three distinct advantages over current policy. First, it will function more like a shock absorber for corn producers and corn users; in contrast, a fixed subsidy in a volatile petroleum market functions like a shock transmitter that amplifies the effect of price swings. Second, it should largely disarm the emerging food- versus-fuel and environment-versus-fuel debates by letting market forces play a larger role in the industry’s future expansion. Finally, it preserves incentives for developing fuel uses in surplus markets, which would encourage continued technological progress in the breeding, production, processing, and use of corn for ethanol. Such developments should continue to improve corn-based ethanol’s competitive position.

Now consider energy policy. With better throttle control on ethanol’s role in the farm-food-feed economy, a fresh approach could also be taken toward U.S. energy policy and ethanol’s place within it. Current policy is too dependent on the political process: picking winners and losers and anointing technologies such as ethanol as favored approaches. Such an approach confronts two huge risks. The first resembles the risk Alan Greenspan foresaw in the U.S. stock market at the beginning of this century: an “irrational exuberance.” In the case of ethanol, the concern is that the enthusiasm for ethanol’s political rewards may run ahead of the logic that governs its economic realities.

A third element in our proposed mix of policies would be the creation of a wide-ranging set of fees and rewards to discourage energy inefficiencies and encourage conservation. Milton Friedman once proposed a negative income tax in which at a certain base income, taxes would be zero and below which subsidies would be paid to families. We propose a broad-based set of fees on energy uses that are carbon-loading and inefficient, but we would subsidize energy efficiency improvements that exceed a national standard. Simple examples would be progressive taxes on automobile horsepower and rebates to hybrid vehicles; fees on housing spaces in excess of 3,500 square feet; and rebates for energy-compliant, economical use of housing space. These “negative pollution taxes” would encourage conservation, while discouraging energy-guzzling cars, trucks, and homes. In particular, these policies could help encourage full–life-cycle energy accounting, tilting the economy toward the use of renewable fuels based on cellulosic alternatives to corn.

Finally, instead of subsidizing the current generation of inadequate cellulosic or coal gasification technologies, we would invest government resources in upstream R&D to bring further innovation and lower costs to these technologies so that they could compete in the market.

To move from our current devotion to corn-based ethanol and toward a new set of policies for renewable fuels will require bravery on the part of those who lead the reforms. The courage to admit that current policies have stoked the ethanol engine to an explosive heat may be in short supply. But unless the ethanol train slows down, it is likely to go off the tracks.

Polishing Belgium’s Innovation Jewel

Situated in the northern part of Belgium, the Flanders region is a natural meeting point for knowledge and talent, attracted by its highly skilled population, splendid cultural heritage, outstanding quality of life, excellent research, and easy accessibility. Its capital city Brussels doubles as the capital of Belgium and the headquarters of the European Union (EU). Additional assets include an open economy, excellent transportation and logistical infrastructure, and EU funding for science and technology development. Flanders has a strong educational infrastructure of six universities and 22 non-university higher-education institutions. These institutions have been grouped into five associations (Leuven, Ghent, Antwerp, Brussels, and Limburg) to facilitate and consolidate the implementation of the Bologna process, which aims to coordinate higher education across Europe.

Over the past quarter of a century, Belgium was gradually transformed from a centralized state into a federal state. During this process, education and nearly all R&D-related responsibilities were devolved to the regional authorities at the level of governance best suited for implementing these policies.

One of the richest and most densely populated European regions (6 million people in an area the size of Connecticut), Flanders has few natural resources. Its open economy is dominated by the service sector and by small and medium-sized enterprises (SMEs). The primary activities in the services sector are education, business services, and health care. Strong economic sectors include the automotive industry, the chemical industry, information and communication technology (ICT), and life sciences. Foreign companies represent almost 25% of Flemish added value and 20% of jobs in Flanders. Exports are extremely important and continue to grow [98.8% of Flanders’ gross domestic product (GDP) in 2005].

Its highly skilled, multilingual population has one of the highest productivity rates in the world. Flanders’ social and economic progress is largely determined by its ability to face and adapt to the constantly changing challenges of the knowledge society in an ever-expanding global environment. This backbone of knowledge is formed by the strong partnership between education, research, innovation, and entrepreneurship.

Reinforcing the scientific and technological innovation base is one of the government’s top priorities. In the mid1990s, the Flemish government started to systematically increase its investment in science and technological innovation. Over the past 10 years, public outlays for R&D almost doubled. They are evenly distributed to support R&D at academic institutions and in companies. In 2005, R&D accounted for 2.09% of Flanders’ GDP, well above the EU average of 1.85%. Businesses provided 70% of the R&D spending.

Increasing spending is a vital condition for a successful R&D policy but not sufficient on its own. The money must be spent wisely, and Flanders has studied successful programs in other countries to learn lessons that it can apply to its own programs. The result has been an R&D portfolio that seems to have the critical ingredients for success:

  • It maintains a balance between basic and applied research and between support for university and industry research.
  • It emphasizes a bottom-up approach where researchers are free to propose their own projects and funds are awarded on the basis of quality.
  • Universities and research institutes are given significant autonomy in directing research. The government provides a block grant to an institution, which must agree to long-term performance goals. Those that meet their overall goals continue to receive funding.

Flanders has been an active participant in EU discussions about innovation policy and has adapted its policies in response to what it has learned. At the Lisbon European Council in 2000, the EU heads of state expressed their ambition for the EU to become by 2010 “the most competitive and dynamic knowledge-based economy in the world, capable of sustainable economic growth with more and better jobs and greater social cohesion.” The 2002 Barcelona European Council set a target for every country to spend 3% of GDP on R&D by 2010, with two-thirds provided by industry and one-third by public authorities.

In 2003, the Flemish government signed an Innovation Pact with the key players from academia and industry. All parties subscribed to the 3% Barcelona target. The Flemish Science Policy Council (VRWB) has been designated to monitor the implementation of the Innovation Pact using a set of 11 key indicators. These include the number of patents, R&D personnel, higher-education degrees, and risk capital.

The most recent monitoring results, published in July 2007, indicate that Flemish innovative capacity remains average. We are not doing enough to transform the country’s excellent academic research results into innovative products, a problem encountered in many other European countries. In addition, only a few (mostly international) companies account for the majority of industrial research activities, making the Flemish economy particularly vulnerable to external events and corporate decisions.

In response, we have begun revising our R&D policy with the aim of resolving the innovation paradox by more effectively tapping into the practical applications of academic research, spreading innovation more broadly throughout the economy, and acquiring the strategic intelligence required to guide an evidence-based R&D policy.

R&D players

R&D in Flanders is carried out in many different places. The main players are the universities, the strategic research institutes, the hogescholen (non-university institutes for higher education), and industry.

Flanders has six universities, which share a threefold mission of education, research, and service to society and third parties. They are based in Leuven, Ghent, Antwerp, Hasselt, and Brussels. Since 2001, the University of Hasselt has been engaged in long-term cross-border cooperation with the Dutch University of Maastricht.

The 22 hogescholen form the second pillar of our dual system for higher education, providing higher education and advanced vocational training outside the universities. Their mission also includes scientific research and service to society. As stated earlier, universities and hogescholen have started to work together much more closely in what are known as associations.

Flanders also has four public strategic research centers, which are active in strategic scientific disciplines:

  • IMEC was founded in 1984 and has since developed into a world-renowned research and training institute for research into microelectronics. It currently employs more than 1,200 scientific and technical staff and has an extensive network of international contacts. Its commercial activities include technology transfers, cooperation agreements with companies, and participation in spin-offs. IMEC received a €39 million block grant from the Flemish government for 2007 (see sidebar).
  • The VIB, founded in 1996, is an inter-university research institute with more than 860 staff in several top-class university units, which operate in the field of biotechnology. Its basic activities consist of fundamental research, including research into cancer, gene therapies, Alzheimer’s disease, protein structures, technology transfer, and information dissemination. VIB’s public grant amounts to €38.2 million in 2007.
  • VITO was set up in 1992 and groups a dozen expertise centers for R&D; it also acts as a reference lab for the Flemish government. It employs more than 400 staff. Noteworthy activities include surface and membrane technologies, alternative sources of energy, and in vitro cell cultures. The public grant for 2007 is set at €35.2 million.
  • IBBT was established in 2003. Its primary mission is to gather highly competent human capital and perform multidisciplinary research made available to the Flemish business community and the Flemish government. This research looks at all aspects necessary for enabling the development and exploitation of broadband services, from technical and legal perspectives to the social dimension. Through investment in multidisciplinary research, the Flemish government wants to empower Flanders as an authoritative and international player in the information society of the future. In 2007, IBBT received €23 million from the Flemish government.

Last but not least, an abundance of market-oriented research is being done in and by companies, primarily SMEs. The government takes an active role in stimulating their participation in innovative research.

There is a growing awareness that innovation also depends on management, public and private governance structures, labor market organization, design, and other factors. The challenge is to develop suitable policy instruments to broaden the scope of innovation.

Policy priorities

The strategic priorities for Flemish R&D policy, as adopted by the Flemish government for the 2004–2009 period, can be summarized as follows:

  • A strong commitment to achieving the 3% of GDP spending target by 2010
  • The introduction of an integrated approach to innovation as a cross-cutting dimension
  • The strengthening of the building blocks for science and innovation (public funding, human resources, public acceptance of science and technology, research equipment, and infrastructure)
  • The efficient use of existing policy instruments for strategic basic and industrial research
  • The reinforcement of tools for knowledge transfer and marketing of research results
  • Continued attention to policy-oriented research and evaluation of existing policy measures
  • A strong emphasis on international cooperation, in both the bilateral and the multilateral context

Tackling the innovation paradox. University researchers have long worried that working with industry would somehow corrupt them and undermine the prestige of their work. Many industry leaders believe that there is little to be gained from working with universities because there is a structural mismatch between the academic research agenda and industry’s needs. In spite of these common preconceptions, Flemish universities and industries have found productive ways to work together. A study by the Catholic University of Leuven provides detailed evidence that Flanders is finding a way out of the innovation paradox and makes proposals on what can be done to advance this process. The key findings include:

  • In 2005, approximately 10% of all R&D expenditure in Flanders was generated in a collaborative partnership between industry and academia. According to 2003 data from the European Commission, industry in Belgium spends 10.9% of its R&D funding in university-related research settings, which is well above the EU average of 6.9% or the U.S. level of 6.3%.
  • Over the period 1991–2004, universities and public research centers have created 101 spinoff companies, including 54 over the past five years.
  • Research teams that work closely with industry also perform very well in basic research.

Encouraged by this evidence, Flanders is taking further steps to enhance university/industry collaboration. In 2004, the Industrial Research Fund (IOF) was established at the universities. The annual budget for this fund is currently around €11 million and is distributed over the six universities on the basis of performance-driven parameters, such as the number of spinoffs created, the number of patent applications, the volume of industrial contract research, and the budgetary share of each university in the European Framework Programme. Beginning in 2008, the annual budget will be increased to at least €16 million.

The IOF provides funds to hire postdoctoral staff who will concentrate on research results that show great potential for market application in the near future. This group of researchers will also be evaluated on the basis of their application-oriented performance. In the near future, the IOF will also allow the universities to fund projects in strategic basic research.

The IOF allows every university and its associated hogescholen to pursue its own policy of creating a portfolio of strategic application-oriented knowledge. Research contracts of this nature will lead to a more permanent structure for cooperation with industry. The aim is thus to stimulate industry-oriented research and to support the creation and/or consolidation of excellent research groups in industry-relevant areas by providing longer-term funding.

A second important instrument is the creation of interface cells at the universities. Functioning as government-funded technology transfer offices (TTOs), these cells help market research results through spinoffs and patents and provide advice on intellectual property rights issues to academic researchers. The operational budget for these TTOs doubled between 2005 and 2007. This increase will help staff and services become more professional and help the offices to deal with the challenge of extending their services to the broader landscape of the associations.

Even though both the IOF and TTOs are in place and it can be reasonably expected that they will make a difference in reducing the innovation paradox, further initiatives are needed. These include facilitating the mobility of researchers between sectors and the use of foresight methodology to assess the potential economic impact of existing and future technologies.

Intersectoral mobility. The movement of researchers between academia and industry is of paramount importance to enhance the exchange of knowledge and methodologies, to refine the research agenda, and to put young researchers in contact with an industrial environment where they can acquire skills not normally taught in an academic program. The main existing fellowship scheme for Ph.D. students is managed by the IWT, which is the Flemish innovation agency for industrial research. Fellows submit an applied research project, typically for a four-year period, which allows them to obtain their Ph.D. In addition, the IWT runs a limited postdoctoral program, which funds, for example, researchers planning to set up their own spinoff company.

The focus of these fellowship programs is obviously on applied research, but they cannot be considered as real intersectoral mobility because researchers are not moving back and forth between companies and university labs. In the months ahead, the Baekeland program will be launched as an alternative funding scheme, taking into account lessons learned from existing programs abroad. The program will establish four-year fellowships for Ph.D. students that are supported with a mix of government and private funds.

Foresight. In 2006, the VRWB undertook a major foresight exercise. With the support of many academic and industrial stakeholders, the VRWB embarked on the challenging task of trying to identify the major scientific and technological areas for the future, taking into account existing research potential, existing economic capacity, links with current international trends, and potential for future growth. The following six clusters have been identified:

  • Transport, services, logistics, and supply chain management
  • ICT and health care services
  • Healthcare, food, prevention, and treatment
  • New materials, nanotechnology, and the processing industry
  • ICT for social and economic innovation
  • Energy and environment for the service sector and the processing industry

Some might want to use these foresight results to send out a strong plea to reinstate thematic priorities in our existing funding channels. This, however, would be an unfortunate return to the past when Flanders had several top-down research programs, which didn’t leave enough breathing space for bottom-up initiatives and for smaller research actors. As said before, Flanders’ current research and innovation policy is based on an open no-strings-attached strategy, which allows and actively invites research proposals defined by the industrial and academic communities themselves. Funding is possible only after a thorough quality check, using the peer review principle as far as possible.

The results of the VRWB’s foresight exercise might become a useful reference instrument when deciding on the funding of new large-scale projects or research consortia. A potential area of application is the development of “competence centers,” which are bottom-up initiatives by industry to create a critical knowledge platform in their respective sectors. Open innovation is the underlying principle: Knowledge is accessible to all participants, and research is done in close collaboration with multiple industrial partners so that costs and risks can be shared. Of course, the necessary intellectual property rights and other legal agreements have to be put in place. About 10 competence poles are currently being funded, ranging from logistics and food to geographical information systems, to product development and industrial design. Foresight might come in handy when checking the feasibility and the potential economic impact of proposals for new competence poles.

Innovation as a horizontal policy dimension. Another major policy challenge is to broaden the concept of innovation to its nontechnological dimensions. Until very recently, Flemish innovation policy has been targeting only the technological dimension of innovation. There is a growing awareness, however, that innovation also depends on management, public and private governance structures, labor market organization, design, and other factors. The challenge is to develop suitable policy instruments to broaden the scope of innovation. The application of innovative public procurement is one of the instruments we are studying at the moment.

One of the policy priorities for the coming years is the “mainstreaming” of innovation; that is, to make sure that innovation becomes a horizontal dimension in all policy fields for which the Flemish government has responsibility. In 2005, the government approved the Flemish Innovation Plan, which puts forward nine main lines of action to stimulate creativity and innovation in all societal sectors, promote Flanders as an internationally recognized knowledge region, invest more in innovation, create an innovative environment, set a good example as a public authority, put more researchers to work, focus on the development of innovation hot spots in cities such as Ghent and Leuven, use innovation as leverage for sustainable development, and integrate innovative approaches into the social welfare system. The government endorsed this plan, which should lead to a horizontally integrated innovation approach across the board.

Strategic intelligence. The expanding rate of globalization and the complexities presented by an open innovation system in which governments no longer have the full range of instruments at their disposal to create an adequate policy mix make it imperative that governments join forces across borders. We need to enhance mutual understanding of our science and innovation systems, both within the national context and internationally.

High-quality and evidence-based policy preparation is possible only if one can bring together a team of policy experts who combine a good knowledge of the more theoretical innovation framework with well-tuned affinities for the practical needs and obstacles encountered on a daily basis by research actors, such as universities, higher-education institutes, or companies. In other words, desk study work and field work need to be combined.

One of the main challenges in the years ahead will be to boost the pool of science and innovation management knowledge capacities in Flanders and network the various agencies and organizations that carry out science and innovation analyses, very often on an ad hoc basis. The Flemish research landscape is so small and the capacity so limited that only a networked approach can yield efficient results. It does not make sense to have small and often isolated study cells at various organizations that are often not aware of each other’s activities. That situation actually reduces efficiency and creates situations where, for example, similar questionnaires are repeatedly sent to the same research units but by different senders. Coordination through a networked approach is clearly the way to go, and we will make this one of our policy priorities for the coming months and years.

As said before, we also need to increase the firsthand field knowledge of those charged with policy preparation. We therefore intend to set up a mobility program, which would allow the temporary exchange of staff among administrations, funding agencies, universities, public research institutes, higher-education institutes, and companies. Such an approach will make participants actively aware of the peculiarities of the “other” and often unknown environments. It will also greatly reduce the number of superfluous rules when designing new research programs or initiatives. Ultimately, greater mutual understanding is also a major contribution to innovation.

All actors in the Flemish research area also stand to benefit from up-to-date online statistical information; for example, on the number of publications and patents, scientific staff, or external contract revenues. This kind of information is not only necessary as an input for international data collection by international organizations but is also a valuable instrument for the government to monitor the impact of its science and innovation policy. Flanders has already taken steps in this direction. The Department of Economy, Science, and Innovation publishes in English and Dutch an annual budgetary overview on science and innovation in its Science, Technology and Innovation Information Guide. The Policy Research Centre for R&D Statistics has been entrusted with the biannual publication of the Flemish R&D Indicator Book. The next issue is planned for this year. As part of the recently approved action plan Flanders i2010, we will embark on the creation of an integrated online database with all relevant R&D data.

Given its strong and close international contacts, Flanders also stands to gain a lot from exchanging information and best practices with partners abroad. There are several instruments that help us in this effort. The European Commission has set up ERA-NETs, OMC-NETs, and INNO-NETs with the specific aim of enhancing innovation expertise and capacity in national administrations. At a bilateral level, Flanders engages in “innovation dialogues” with the Netherlands, Wallonia, and the United States.

After more than 15 years of continuous increases in public R&D spending, the Flemish funding system is reaching a state of completion; most of the funding instruments for curiosity-driven research, strategic basic research, and innovation are in place. The challenges ahead are to streamline these instruments, reducing overlaps and remaining obstacles, and to raise their effectiveness in tackling the innovation paradox. In this context, international policy-learning is extremely valuable, and this will be one of the priorities for the coming years.

From the Hill – Fall 2007

President Bush signs competitiveness bill

On August 9, President Bush signed into law the bipartisan America COMPETES Act (H.R. 2272), aimed at bolstering basic research and education in science, technology, engineering, and mathematics (STEM) to ensure the nation’s continued economic competitiveness. Despite signing the bill, however, the president expressed concerns about some of its provisions and said he would not support funding some of its authorized spending.

The passage of H.R. 2272 culminates two years of advocacy by the scientific, business, and academic communities, as well as by key members of Congress, sparked by the release of the 2005 National Academies’ report Rising Above the Gathering Storm.

The legislation, which incorporates many prior bills, authorizes $33.6 billion in new spending ($44.3 billion in total) in fiscal years (FY) 2008, 2009, and 2010 for a host of programs at the National Science Foundation (NSF), Department of Energy (DOE), National Institutes of Standards and Technology (NIST), National Oceanic and Atmospheric Administration (NOAA), National Aeronautics and Space Administration (NASA), and Department of Education. It puts NSF and NIST on a track to double their research budgets over three years by authorizing $22.1 billion and $2.65 billion, respectively. It also authorizes $5.8 billion in FY 2010 for DOE’s Office of Science in order to complete the goal of doubling its budget.

The act’s sections on NSF, DOE, and the Department of Education all have significant educational aspects. They are broadly aimed at recruiting more STEM teachers, refining the skills of current teachers and developing master teachers, ensuring that K-12 STEM education programs suitably prepare students for the needs of higher education and the workplace, and enabling more students to participate in effective laboratory and hands-on science experiences.

At NSF, for example, the law expands the Noyce program of scholarships to recruit STEM majors to teaching. DOE’s role in STEM education will be expanded by tapping into the staff expertise and scientific instrumentation at the national laboratories as a resource to provide support, mentoring relationships, and hands-on experiences for students and teachers. The Department of Education will become involved in developing and implementing college courses leading to a concurrent STEM degree and teacher certification.

The act would replace the Advanced Technology Program at the Department of Commerce with the Technology Innovation Program, with the primary goal of funding high-risk, high-reward technology development projects.

It also authorizes DOE to establish an Advanced Research Projects Agency for Energy (ARPA-E) to conduct high-risk energy research. With authorized funding of $300 million in FY 2008, the new agency is to be housed outside of DOE’s Office of Science, ostensibly to ensure that it does not rob from the Office of Science’s budget.

At the White House signing ceremony, President Bush had kind words in general for the legislation but also said that some of its provisions and expenditures were “unnecessary and misguided.”

Noting that the legislation shares many of the goals of his American Competitiveness Initiative (ACI), such as doubling funding for basic research in the physical sciences and increasing the number of teachers and students participating in Advanced Placement and International Baccalaureate classes, he said, “ACI is one of my most important domestic priorities because it provides a comprehensive strategy to help keep America the most innovative nation in the world by strengthening our scientific education and research, improving our technological enterprise, and providing 21st-century job training.”

But he said he was disappointed that Congress failed to authorize his Adjunct Teacher Corps program to encourage math and science professionals to teach in public schools, and he criticized 30 new programs that he said were mostly duplicative or counterproductive, including ARPA-E, whose mission, he said, would be more appropriately left to the private sector.

Bush also said the legislation provides excessive funding authority for new and existing programs, adding that, “I will request funding in my 2009 budget for those authorizations that support the focused priorities of the ACI but will not propose excessive or duplicative funding based on authorizations in this bill.”

Among those at the signing ceremony were congressional leaders who were key to shepherding the bill through Congress, including Rep. Bart Gordon (D-TN), chair of the House Science and Technology Committee, who said, “I am very concerned that the next generation of Americans can be the first generation to inherit a national standard of living less than their parents if we don’t do something. This bill will help turn that corner.”

Climate bills address competitiveness concerns

Several bills have been introduced in the Senate aimed at alleviating concerns about the potential impact that addressing climate change could have on U.S. economic competitiveness.

Sens. Jeff Bingaman (D-NM) and Arlen Specter (R-PA) introduced the Low Carbon Economy Act of 2007 (S. 1766) on July 11. It features a cap-and-trade system with targets to reduce greenhouse gases to 2006 levels by 2020 and 1990 levels by 2030. The bill encourages the development and deployment of CCS technology with a system of bonus emissions credits for companies that implement the technology.

S. 1766 contains provisions on international engagement meant to assuage critics of climate policies that do not include growing emitters such as China and India. The bill requires that the United States attempt to negotiate an agreement with other nations to take “comparable action” to address climate change. Beginning in 2020, the bill allows the president to require importers from countries that are not taking action to submit emission allowances for certain high-carbon products such as cement. Prices for these “international reserve allowances,” which would constitute a separate pool from domestic allowances, would be equal to those for domestic allowances, fulfilling a key tenant of trade law that tariffs be applied equally to domestic and foreign products.

The bill also attempts to limit costs by incorporating a cap on the price of emissions, referred to in the bill as a technology-accelerator payment but known to many as a safety valve. The price starts at $12 per ton of carbon and rises at a rate of 5% above inflation annually. A safety valve has been embraced by many in industry for providing price certainty, but criticized by economists and environmentalists who say it interferes with the power of the market and may also prohibit linkages with other international trading schemes.

Sens. John Warner (R-VA), Mary Landrieu (D-LA), Lindsey Graham (RSC), and Blanche Lincoln (D-AR) are using a different tactic to limit the costs of climate change legislation in a proposal Warner called “an emergency off ramp.” Their bill, Containing and Managing Climate Change Costs Efficiently Act (S. 1874), would create a Carbon Market Efficiency Board, modeled on the Federal Reserve Board, to regulate the market for carbon allowances. When prices are sustained above a certain threshold, the board could effectively reduce prices by borrowing credits from future years to expand the number of carbon permits available. The bill does not contain targets or timetables for greenhouse gas reductions, as sponsors intended for the proposal to be incorporated into a broader cap-and-trade proposal.

Warner, the ranking member of the Senate Subcommittee on Private Sector and Consumer Solutions to Global Warming and Wildlife Protection, ensured that the carbon market board provision would be included in at least one bill when he and Subcommittee Chair Joe Lieberman (ID-CT) incorporated it into the climate bill they plan to introduce in the fall of 2007. The America’s Climate Security Act will include provisions to establish a Carbon Market Efficiency Board, as well as provisions from the Bingaman/Specter bill to encourage other countries to address climate change. The draft calls for cuts in greenhouse gas emission of 70% below 2005 levels by 2050. Initially, 24% of the credits would be auctioned, with that amount rising to 52% in 2035. The auction would be run by a new Climate Change Credit Corporation and the proceeds used to promote new technology, encourage CCS, mitigate the effects of climate change on wildlife and oceans, and provide relief measures for poor nations.

Confrontation looms on R&D budget

The Senate and House are poised to add billions of dollars above the president’s budget request to the FY 2008 R&D budget, with much of the proposed new funding targeted for environmental, energy, and biomedical initiatives, according to an August 6 report by the R&D Budget and Policy Program of the American Association for the Advancement of Science (AAAS).

Congressional funding proposals also would meet or exceed the president’s spending plans for physical sciences research in the president’s ACI and for dramatic expansion of spending to develop new craft for human space exploration, said Kei Koizumi, the program’s director.

Whereas the White House proposed a budget for the fiscal year beginning October 1 that would have cut overall basic and applied research investment for the fourth straight year, Congress would increase research budgets at every major nondefense R&D agency. And with Congress exceeding the president’s overall domestic spending plan by $21 billion, there is the possibility of a budget conflict that could extend into FY 2008.“Because the president has threatened to veto any appropriations bills that exceed his budget request, these R&D increases could disappear or diminish this fall in negotiations between the president and Congress over final funding levels,” Koizumi concluded. Koizumi noted that earmarks— funds designated by Congress to be spent on a specific project rather than for an agency’s general policy agenda— account for one-fifth of the proposed new R&D spending.

According to the report, the House has approved all 12 of its 2008 appropriations bills; the Senate Appropriations Committee has drafted 11 of its 12 bills, but the full Senate has approved only the spending bill for the Department of Homeland Security. The Senate still must draft a spending bill for DOD. In all, appropriations approved by the House total $144.3 billion for R&D, $3.2 billion or 2.3% more than the current budget and $4 billion more than the White House 2008 budget proposal. The Senate would spend $500 million more on R&D than the House for the appropriations it has drafted.

Based on action thus far, Koizumi summarized congressional moves in several critical science and technology areas:

Energy: DOE’s energy-related R&D initiatives had received significant increases in 2007, but the Bush administration requested cuts for 2008. Congress would keep increasing DOE energy R&D spending dramatically, by 18.5% in the House to $1.8 billion and 29% to $2 billion in the Senate for the renewable energy, fossil fuels, and energy conservation programs, Koizumi reported.

Environment and climate change: Congress would turn steep requested cuts into increases for environmental research programs. Total R&D spending on environmental initiatives would rise 9.2% under House measures, compared to a 3% cut proposed by the administration. NOAA R&D, for example, would get a 9.9% increase in the House and 18.1% in the Senate. Among other prospective winners: the Environmental Protection Agency (EPA); the U.S. Geological Survey; and NASA. Some of the proposed funding for NASA would go to address concerns expressed by the National Research Council, the AAAS Board of Directors, and others that the number of Earth-observing sensors on NASA spacecraft could plunge in the years ahead if current NASA budget trends continue.

Biomedical advances: Lawmakers in both chambers would add more than $1 billion to the White House’s spending plan for the NIH budget, turning a proposed cut into an increase. But both the House and Senate would direct a significant part of that increase to the Global Fund for HIV/AIDS. As a result, the House plan would give most NIH institutes and centers raises of 1.5 to 1.7%, well short of the 3.7% rate of inflation expected next year in the biomedical fields; the institutes and centers would get 2.3 to 2.5% raises under the Senate bills.

STEM education: In addition to their support of STEM education measures in the ACI and America COMPETES act, lawmakers would add significantly to NSF education programs. NSF’s Education and Human Resources budget, after years of steep budget cuts, would soar 18% in the House and 22% in the Senate. Overall NSF R&D spending was cut in 2005 and 2006 but would jump to a record $4.9 billion in FY 2008 under both House and Senate plans.

NASA: After a decade of flat funding, overall NASA R&D funding would jump 9.8% under the House plan and 8.4% in the Senate. Both chambers would endorse large requested increases for the International Space Station facilities project and the $3.1 billion Constellation Systems development project to replace the Space Shuttle and carry humans toward the moon.

Energy bills face veto threat

After a contentious debate, the House passed two energy bills on August 4, but the bills will now have to be reconciled with a Senate bill that has different provisions and will face a veto from President Bush, who said the bills “are not serious attempts to increase our energy security or address high energy costs.”

The House approved the New Direction for Energy Independence, National Security, and Consumer Protection Act (H.R. 3221) and the highly contested Renewable Energy and Energy Conservation Tax Act (H.R. 2776). H.R. 3221, the broader energy package promised by House Speaker Nancy Pelosi, includes a renewable electricity standard but does not include higher corporate average fuel economy (CAFE) standards. H.R. 2776, a $16 billion bill that has received much criticism, increases tax incentives for renewable energy by reducing existing incentives for the oil and gas industries. The two bills were rolled into one after their passage under the rule for floor debate.

The House managed to push the speaker’s broad energy bill through with a vote of 241 to 172. The legislation’s star provision is a renewable electricity standard, which mandates that utilities produce 15% of their power from renewable sources by 2020. Utilities will be allowed to meet some of that requirement with energy efficiency measures. Originally, the standard was pegged at 20%, but it was reduced to 15% after many members noted that it might be difficult for some states with limited renewable sources to meet the requirement. The mandate does not apply to rural electric cooperatives and municipalities.

H.R. 2776 was intentionally kept separate from the broader energy package because of its doubtful acceptance on the House floor. The legislation ran into staunch opposition from the White House, Republicans, and oil-state Democrats immediately after being introduced, because it reduces tax incentives for the oil and gas industries in order to pay for renewable energy sources. A similar Senate package failed last month, but the House bill passed 221 to 189 with 11 Democrats defecting and 9 Republicans voting yes.

The conference between the House and Senate to reconcile the different bills will be a challenge. For example, the Senate bill includes a higher CAFE standard but not a renewable fuel standard. The Senate bill also includes provisions to increase ethanol and alternative fuel production, but the House bill does not.

Senators agreed to increase the CAFE standard from the current level of 27.5 miles per gallon (mpg) for cars and 22.5 mpg for light trucks to 35 mpg per fleet by 2020. The Senate bill mandates the use of 36 billion gallons of renewable fuel by 2022, a more than sevenfold increase from 2006 levels. In response to concerns about the environmental and economic effects of corn-derived ethanol, 21 billion gallons of this standard must be met with “advanced” biofuels such as cellulosic ethanol.

Proposals to fund coal-to-liquid technology were defeated by Democrats, who are opposed to supporting a fuel that would emit more carbon dioxide than conventional gasoline. However, measures to increase funding for carbon capture and storage (CCS) R&D were incorporated.

The Senate did not include language from a tax package prepared by the Finance Committee, though it may be inserted when the bill goes to conference. The tax package, worth $32.2 billion, would create incentives and subsidies for conservation and alternative energy, including clean coal technologies, CCS, cellulosic ethanol, and wind power. These programs would be funded by raising taxes and eliminating tax breaks now available to the oil industry. Many opposing the tax package said it would raise the cost of oil and gas production at a time when it is already unmanageable.


“From the Hill” is prepared by the Center for Science, Technology, and Congress at the American Association for the Advancement of Science (www.aaas.org/spp) in Washington, D.C., and is based on articles from the center’s bulletin Science & Technology in Congress.

Mexico’s Innovation Cha-cha

Like many nations, Mexico has been making an effort to increase its investment in R&D and in scientific manpower. But although Mexico’s investment in science has grown significantly in absolute terms during the past few decades, the country still lags far behind others. In 2004, nations that are part of the Organization for Economic Cooperation and Development (OECD) on average invested 2.3% of their gross domestic product (GDP) in R&D. Mexico’s R&D investment in 2004 was less than 0.4% of GDP, a ratio that has remained essentially constant during the past decade. Why has Mexico been so slow to invest in R&D? What are the implications of this? And what can be done about it?

Historically, economic activity in Mexico was largely based on exploiting its abundant natural resources, with oil production accounting for an important share of GDP. In addition, its economy was closed and heavily regulated. As a result, until recently, Mexican companies have had little incentive to innovate and did not perceive the need to invest in R&D. Similarly, science and technology (S&T) was largely absent from the government agenda.

Mexico’s S&T system began around 1930 with the creation of the National Institutes of Health, with government support dedicated almost exclusively to improving the nation’s health. In 1960, the country took a first step toward broadening its S&T effort through creation of the National Institute for Scientific Research (Instituto de Investigación Científica), which provided scholarships to fund undergraduate college theses and graduate education.

Mexican S&T began to evolve during the 1970s. First, the Mexican higher education system expanded as a number of large public universities were established. Mexico’s economic development strategy was based on import substitution, and increasing education levels was seen as critical to making this approach work. Second, in 1970, the National Institute for Scientific Research became the National Council for Science and Technology (Conacyt) and began to award research grants. Although these early grants were minor and worked mostly as complements to the higher education expansion effort, S&T investment had finally entered the policy arena. As a result of these policies, a small, active scientific community in Mexico was established.

Then the severe financial crisis of the 1980s hit. Mexican inflation levels reached more than 150%, and purchasing power dropped dramatically. Inflation’s impact fell heavily on the middle class, which included university professors. As a result, the few scientists that the country had been able to foster started leaving, mainly for the United States.

In an attempt to avoid a total collapse of the budding scientific community, Mexico created the National System of Researchers (SNI – Sistema Nacional de Investigadores) in 1984. SNI supplemented the salaries of the most productive researchers. This program has remained active, becoming a distinguishing feature of the Mexican S&T system. The number of SNI researchers grew from fewer than 7,000 in 1992 to more than 12,000 in 2005. In 2003, about 30% of the researchers in Mexico were members of the SNI. They published about 85% of the Mexican international peer-reviewed publications in the ISI Thompson Web of Science Database. Currently, researchers receive recognition— and a significant part of their incomes—by being part of SNI.

Mexican S&T begins to stir

By the end of the 1980s, Mexican economic policy had changed. Import substitution was abandoned, and the country moved toward a deregulated and open economy. Mexico became a member of the General Agreement on Tariffs and Trade (GATT) and signed the North America Free Trade Agreement (NAFTA). These changes had an impact on science as well as trade. In 1991, the first World Bank loan for S&T in Mexico led to the creation of PACIME (Programa de Apoyo a la Ciencia Mexico). This program provided $150 million to support scientific activities, with a matching amount provided by the Mexican government. The funds enabled the creation of a number of new initiatives: programs for research but also for equipment, infrastructure, retention of scientists, and endowed chairs.

These initiatives had a significant impact on S&T investment in Mexico. Federal S&T expenditure as a percentage of GDP increased from 0.28% in 1990 to 0.33% in 1991. By 1994, it had reached 0.41%, roughly the level of today. Moreover, Conacyt, which became the primary agency responsible for defining and implementing S&T policy, saw its budget increase more than 230% in real terms from 1989 to 1994.

During the 1990s, the main objectives of S&T policy were increasing the country’s capacity in scientific research, supporting advanced training, and to a lesser extent, supporting technological development. Almost all the programs created by PACIME remained and their administration improved. Conacyt’s budget reflected these priorities, with only a small proportion dedicated to promoting innovation. In the 1993 budget, 26% went to science, 2% to technology, 29% to scholarships, 20% to SNI, and the remaining 23% for other programs. This distribution remained similar during the rest of the decade. These programs have had an impact in Mexican science, with national researchers publishing more papers. According to ISI, the participation of Mexican scientists and engineers in the global scientific production increased from 0.2% in 1993 to 0.5% in 2003.

By the turn of this century, Mexico’s S&T system had grown in size, output, and international impact, but its S&T investment had not keep pace with the country’s economy. According to OECD figures, gross R&D expenditures as a percentage of GDP was 2.65% in the United States, 1.58% in Canada, but remained at 0.40% in Mexico— the last place among OECD countries in terms of resources devoted to S&T. Similarly, Mexico also has a limited pool of science manpower. As recently as 2002, it had only 0.33 full-time researchers per 1,000 inhabitants. Brazil and Poland had 0.45 and 1.53 per 1,000 inhabitants respectively, and developed nations are typically much above these figures.

Still, Mexican S&T, although small, is quite efficient and effective on an individual researcher basis. The average researcher publishes more papers and is cited by other researchers more often than in most comparable nations. In 2003, Mexico was publishing 1.14 ISI papers per full-time equivalent researcher, compared to 0.74 in Brazil and 0.83 in Poland.

New policies and innovation

Because the emphasis in the 1990s was on increasing the amount and quality of Mexican scientific research, only 2% of Conacyt’s budget was spent on technology development. In the early 1990s, Conacyt designed its first programs to foster industry innovation. The R&D Technological Modernization Trust Fund (Fondo de Investigación y Desarrollo para la Modernización Tecnológica, FIDETEC) was established to provide warranties and long-term financing for precommercial R&D. Complementary initiatives were also created, including one program to promote university-industry linkages (PREAEM), another to encourage the creation of technology-base incubators (PIEBT), a third supporting private research centers (FORCCyTEC), and, finally, a program to improve technology information (RCCT). However, scarcity of resources, together with high interest rates, lack of capacity for risk evaluation, and poor program design led to very low demand for these programs. Consequently, their impact was modest at best.

A second set of initiatives for promoting innovation happened only late in the 1990s. First, resources from the second World Bank loan for S&T were assigned to new programs devoted to the enhancement of technological innovation (PCI – Programa de Conocimiento e Innovación). Second, a system of fiscal incentives for S&T was established. But despite this new set of resources from the World Bank, very few companies submitted projects to the program, and even fewer ended up receiving support.

The slow pace of these programs was due partly to the extremely low investment of the business sector in innovation activities, in particular R&D. The long history of economic protectionism in Mexico had created a social environment with very little appreciation for innovation. In 1999, only a little more than 20% of gross expenditures in Mexican R&D was financed by companies, whereas in Brazil companies contributed 40% and in Korea more than 70%. Moreover, since few Mexican scientists worked in industry, university-industry research collaborations were almost nonexistent.

As the millennium began, the Mexican innovation system displayed some progress, but also enormous gaps. This became even clearer when the new administration that began in 2000 put together its S&T plan. The administration prepared a diagnosis of the state of national S&T, which included contributions from the S&T community as well as the consulting body for the federal government, Foro Consultivo Científico y Tecnológico. It concluded that:

  • S&T expenditures were very low
  • The business sector contribution to R&D was particularly small
  • The proportion of R&D money applied to experimental development was below the amounts that other advanced developing countries were spending
  • The S&T community had a very small size
  • Mexican industry had little international competitiveness
  • The number of patents filed by Mexicans was extremely small

The response was the Special Program on Science and Technology 2001-2006, which had three objectives: a federal law encouraging S&T, increased national S&T capacity, and strengthened competitiveness and innovation in companies. Among the program’s goals were increasing the number of people in S&T, consolidating the scientific infrastructure, using science and technology to solve national and regional problems, increasing the quantity and quality of Mexican science, and persuading the public that innovation was essential to economic development.

Thus, one of Conacyt’s first actions in 2001 was the submission of a new S&T law. This S&T Act, approved by Congress in 2002, conferred on Conacyt responsibility for coordinating the S&T activities and budgets of all federal agencies. In addition, Conacyt was given new status and autonomy, no longer reporting to the Ministry of Education but instead directly to the president. Finally, the law specified committing 1% of GDP to S&T by the end of the administration in 2006. The law placed special emphasis on applied research with the purpose of linking scientific activities to national problems and directing science into areas of social value.

This effort included a number of new programs and important changes to existing ones; for example, revamping the 1998 law to simplify regulations and procedures for companies applying for innovation incentives. Most critical among the new programs was creation of two groups of funds, the Sector Funds (Fondos Sectoriales) and the Mixed Funds (Fondos Mixtos). The Sector Funds operated in conjunction with federal agencies and were supposed to finance projects that addressed the strategic needs of the nation; for example, in health, environment, and agriculture. In principle, they operated with matching funds between Conacyt and the different federal agencies. The Mixed Funds were directed to regional development and operated with matching funds between Conacyt and the states of Mexico.

Another fund, the Institutional Fund (Fondo Institucional), was managed solely by Conacyt. One of its main new programs was AVANCE, created in 2003. AVANCE includes three programs: Last Mile, which supports the last stages of innovation; the Entrepreneurs Fund (managed in conjunction with NAFIN, Mexico’s state development bank), which supplies angel capital; and the Warranty Fund, which endorses companies aiming to get commercial bank loans.

New policies, but disappointing results

The 2002 S&T Act generated strong expectations about the evolution of Mexican S&T. But these expectations were not fulfilled. First and foremost, the government did not supply the necessary actions and resources. During the administration of Vicente Fox, the government declared that it was strongly committed to S&T development, with the president personally promising to grow R&D investment until reaching 1% of GDP by 2006. But the president did not keep his promise, and the government did not support its declaration with political will or money.

From 2002 to 2006, the Mixed and Sector Funds supported only 7,122 projects. Just after the funds were established, in 2002, outlays increased, totaling $170 million and reaching a high of $180 million in 2003. But since then, support has dropped to a little over $120 million per year, an amount only slightly larger than in the pre-Fund years 1999 and 2000.

AVANCE has also had only a modest impact. By the end of 2005, only 69 proposals had been approved as part of the Last Mile initiative, with outlays totaling $14.2 million. Under the Entrepreneurs Fund program, just nine companies had received support by the end of 2005. The number of companies that have applied for and received support is extremely low for the size of the country.

Several factors help explain the disappointing results of these programs. First, despite the government promise, the federal budget for S&T increased very little, allowing only for maintenance of existing programs and not for implementation of new ones. The reason was large increases in the SNI and scholarship programs, which absorbed most of Conacyt´s budget. Thus, although the promotion of innovation in the business sector was supposed to be a key priority in the 2002 Act, few resources were in fact allocated to these new programs.

Second, Conacyt responded poorly to its new charter. The new S&T Act made Conacyt responsible for coordinating S&T efforts of all federal agencies, including the establishment of new policy instruments to foster participation of state governments. Yet no institutional change took place. Conacyt remained basically the same, with new responsibilities assigned in a fragmented way within the old structure. This led to organizational inertia and limited the visibility and preeminence of the new initiatives.

Third, implementation of the new programs encountered several problems that delayed their development substantially. The new coordinating role of Conacyt at the federal level was hindered by the Secretaria de Hacienda, the agency in charge of the federal budget. In particular, Hacienda often declined or delayed outlays for industry projects. On the one hand, Hacienda officials did not see S&T as an important priority for the country, considering instead that investment in areas such as health and education were much more critical. On the other hand, Hacienda had in place a set of detailed procedures on how to allocate and spend public money, procedures that could not be applied easily to research and innovation projects.

If Mexico is to be a player in the global economy, it has no choice but to increase its S&T investment—increase it significantly.

These new programs were also hindered by a lack of rigorous planning. Processes for establishing strategic needs for the various federal and state agencies were not very strict. In particular, there was no clear procedure for setting priorities in the research agendas and operation of the Sector and Mixed Funds. This led to requests for proposals (RFPs) that did not necessarily reflect the actual requirements of the federal agencies and state governments. Instead, RFPs were often shaped by particular views of small groups within the agencies. As a result, the original plan for setting priorities based on need was not quite achieved.

The modest results also reflected lack of appreciation for technological development and the scarcity of private sector investment in innovation. Although some progress had been achieved during the 1990s, these had remained important features of the Mexican economy.

Finally, Mexico still lacked a critical mass of people trained in managing S&T issues, both private and public. The small size of the system and the novelty of these innovation-oriented programs meant that there were few scientists or engineers who knew how to design, implement, and properly follow up on them. For example, a criticism often made of the AVANCE program is that it was structured and managed to support mainly radical innovations, with no complementary initiatives aimed at boosting incremental or process innovations. This further limited the interest of companies.

A small silver lining

Despite these limitations, it is important to note that these new programs, especially AVANCE, were quite innovative and have produced indirect results critical to the future of the innovation system in Mexico. First, they triggered the interest of investors in R&D projects. Second, they fostered the creation of technical capacity for identifying and evaluating R&D projects, a capacity that had previously been nonexistent in Mexico and that, as explained above, contributed to the limited impact of the programs. Moreover, they promoted the creation of angel funding and venture capital, which had been virtually absent in the country. Finally, they also favored a culture of innovation management in Conacyt and other agencies, which until then had focused chiefly on the science dimension.

Fiscal incentives to support S&T activities have been one of the few success stories of the new initiatives after the new S&T Act was passed. The program was established in 1998, providing a recovery rate of 20% for R&D expenses, with a budget of 500 million pesos (approximately $56 million). In 2001 the rate was changed to 30%, and in 2006 the threshold was changed to 4 billion pesos (approximately $364 million). Despite the 1998 enactment, tax incentives for S&T were almost nonexistent in practice until 2001. Heavy-handed reporting regulations and the shortsighted perspective of Secretaria de Hacienda effectively treated this initiative as a loss of revenues for the government. Thus, it made every effort to limit the incentives awarded. As a result, in 2000, Hacienda approved less than 2% of the $50 million available for tax incentives. In 2001, regulations were altered, and a dramatic change in perspective occurred. Incentives are now being fully used, with awards increasing from less than $50 million in 2000 to $100 million in 2004 and close to $400 million in 2006.

The positive evolution in fiscal incentives reflects another accomplishment. During the past few years, the business sector has increased investment in R&D. In 2006, 38% of Mexico’s R&D was financed by the private sector, compared to only 14% in 1993.

Perspectives for the future

As we have shown, although Mexico’s investment in S&T has grown significantly in recent decades in absolute terms, it has trailed the economic evolution of the country. Mexico has been among the first 15 nations in the world in terms of GDP during the past 20 years, but it stands in last place among the OECD countries in terms of resources devoted to S&T. This is hardly the basis for using S&T as a real anchor for development and global competitiveness.

During the past 20 years, there have been a number of serious and rigorous analyses to diagnose the structural problems and needs of the Mexican innovation system. Practically all of them agree on some key issues. First, the S&T community is active and productive, but very small. It is also mostly concentrated in universities and research institutes, not the private sector. In fact, most Mexican companies still invest little in R&D to sustain their competitiveness. The national innovation system is disintegrated, and cooperation among industry, academy, and government is almost nonexistent. In general, there is little appreciation for S&T among the public.

At this point, Mexico’s S&T doesn’t need more diagnosis, it needs action. The country seems able to create innovative mechanisms for fostering scientific capability and to integrate demand and supply of R&D. An incentive scheme directed at researchers has helped establish a small but productive scientific community. Innovation programs are beginning to change the culture of R&D commercialization. But these programs are small and far from reaching their full potential.

Thus, first and foremost, government officials and legislators deciding on the appropriation of resources need to redistribute scarce resources away from other areas so they can significantly increase the budget for S&T. It will take vision and political will to do that. Yet if Mexico is to be a player in the global economy, it has no choice but to increase its S&T investment—increase it significantly. Added resources will also help increase the number of scientists and engineers in the workforce, not only in academia but also in industry.

But the recent experience with the 2002 S&T Act suggests that, in addition to resources, other critical issues must be addressed in order to succeed in implementing new science, technology, and innovation initiatives. An initial dimension that now seems to be mostly overcome is the existence of a new cadre of people able to manage S&T programs. Despite their limited success, the early initiatives were essential in training this group of people. Another is to recognize that successful implementation of S&T programs requires active mobilization of all stakeholders, in particular those that control or influence resources. Institutions within the S&T system in charge of critical programs need to find ways to include heads of government ministries, federal agencies, and even states in the process. A third approach is to recognize that regulatory and institutional structures can be almost as important to success as resource availability. Therefore, these structures need to be carefully considered together with program development and deployment. Finally, Mexico’s entrepreneurs, academics, legislators, and government officials should at last acknowledge and embrace the social and economic relevance of science, technology and innovation.

Getting Our Act Together

Getting Our Act Together

Several of the articles in this issue look beyond specific policy debates to the larger question of the definition of science policy (in the broad sense that includes technology and health policy). The question deserves to be discussed, and it raises the related issue of whether there exists an organized science, technology, and health policy community within which this discussion can take place.

Daniel Sarewitz bemoans the incredible shrinking vista of science policy, which too often focuses exclusively on the federal research budget. In the course of pointing out that the long-term stability of government R&D spending suggests that this is a debate without a difference, he also observes that Congress’s Rube Goldberg committee structure and budget process make it virtually impossible to have a debate about the fundamental issues that should be part of science policy. He makes a compelling case that the real science policy discussion should not be about “how much,” but about “what for.”

Ronald Sandler and Christopher J. Bosso see the National Nanotechnology Initiative (NNI) as an opportunity to take a prospective approach to regulating a new technology and to implement an expansive vision of science policy that encompasses not just health and environmental effects but a broad swath of social and economic outcomes that could accompany the development of an important new technology.

Science policy, to use the shorthand designation, is a discipline that is still in its adolescence. Most science policy professionals were trained in other disciplines, in part because there were no science policy programs when they went to school. This motley mix of philosophers, economists, physicians, attorneys, engineers, political scientists, chemists, historians, and who knows what else has managed to create an intellectual subculture that somehow manages to provide insight to decisionmakers about how developments in science, technology, and medicine should inform public policy and private actions. But the field has yet to form itself into a well-defined intellectual or professional community. Just as Congress has failed to create the forum for discussion of basic science policy issues, the community of practitioners and scholars has yet to create the stage on which critical discussions can occur.

Some people think they remember a golden age of science policy following World War II and continuing through the space race, an era in which Vannevar Bush provided a coherent vision and scientists such as Robert Oppenheimer were taken seriously by policymakers. And although it is true that the atomic bomb and the race to the moon provided cachet, at least for nuclear physicists and a few aerospace engineers in the corridors of power, this was not a time of broad-based science policy preeminence. It was a time when a simplistic linear model of innovation was accepted and before the appearance of thorny concerns about industrial policy, intellectual property rights for university researchers, the emergence of universities as significant players in commercial technology, and the hornet’s nest of bioethical issues that have emerged with the revolution in biology. Our understanding of what falls under the rubric of science policy has expanded immensely, and we can now see that the golden age was actually just a simpler time.

Today’s complexity is reflected in the number of organizations that participate in some aspect of science policy. The White House has an Office of Science and Technology Policy (OSTP), and the president has a bioethics council and a council of advisors on science and technology. The National Research Council (NRC) conducts a few hundred science policy studies a year with its stable of volunteer experts, and a few dozen universities have programs in science policy, science and society, or specific areas such as environmental policy. The American Association for the Advancement of Science (AAAS) hosts an annual policy conference in Washington, and there is even a Gordon Research Conference in science policy that meets every two years. Numerous other professional groups, think tanks, and advocacy organizations also play an active role in science policy.

Yet in many ways there is no there there. OSTP is not perceived as a power center in the west wing. The NRC is widely respected and influential, but most of its work is driven by outside requests from Congress or the administration. The AAAS meeting focuses heavily on the federal budget. The Gordon Conference has a broad focus but has yet to attract broad participation from all corners of the science policy world. No focal point exists for this diffuse amalgam of science policy activities, and no focal point exists for science policy. Specialists in agriculture policy rarely interact with colleagues in health policy. The ethicists and philosophers have little interaction with the economists. Although there is wide recognition that science is a pervasive influence throughout society, that critical policy decisions must take into account a complex variety of perspectives and types of expertise, and that many of the problems facing humanity will be solved with coordinated multidimensional efforts, we have yet to develop the structures within government or the integrated network outside government that would make it possible to approach problems with the necessary combination of intellectual resources.

Sandler and Bosso argue that the NNI provides an opportunity to take a truly comprehensive approach to understanding the social context and possible repercussions of the development and introduction of a powerful new technology. No doubt the NNI program managers are wondering where they would find the time and resources to do anything with nanotechnology if they have to tackle, in Sandler and Bosso’s words, “unequal access to resources and opportunities, institutionalized and non-institutionalized discrimination, differential social and political power, corporate influence and lack of accountability, inadequate governmental capacity to fulfill regulatory mandates, challenges to individual rights and autonomy, marginalization of non-economic values, technology control and oversight, the role of technology in creating and solving problems, and, more generally, those aspects of our society and institutions that fail to meet reasonable standards of justice.”

The problem is not that these considerations are irrelevant to the introduction of a new technology, it is that it is a staggering burden to assign this task to a single program, even one as large as NNI. We should be having this discussion on a larger stage. Progress in all areas of science, technology, and medicine can have powerful effects throughout society. If there were an organized science policy community, people from many disciplines and areas of expertise could be sharing ideas and experiences; those charged with looking at the possible repercussions of a specific technology could then draw on this body of knowledge and wisdom.

We need to create a more coherent science policy community that is building this core body of knowledge, one that incorporates theory and practice, that is alert to the importance of value judgments in many of these areas, that is available to practitioners confronting specific policy problems, and that is constantly evolving to incorporate new insights from all the disciplines that participate in science policy. Many of the people working in science policy see themselves as more than technocrats. They need to find a way to work together. They will not only become more productive technocrats; they will become a significant part of the larger community of public intellectuals. Science, technology, and medicine are key drivers in human development, and those who best understand these forces should be key players in setting humanity’s course.

The Politics of Jobs

Speaking recently to a group of lawyers, Ralph Cicerone, president of the National Academy of Sciences, voiced concern about U.S. science literacy and called for expanding the science talent base. The lawyers took him on. In contrarian lawyer fashion, they asked: Why should we pay for this huge education bill? Why can’t scientists just be a small elite group? Why do we need more science education and more scientists? Although Cicerone legitimately could have asked why we need more lawyers, he instead responded by saying that science education isn’t just a matter of whether we can keep our economy but whether we can also keep our democracy.

Richard Freeman implicitly asks the same question. A leading labor economist, Freeman respects the dynamism of the U.S. labor market, yet expresses fears about its disparities. He considers the U.S. labor market to be exceptional, because of its weak safety net and modest regulatory protections (in marked contrast to the extensive worker protections in Europe and Japan). Although the U.S. system has sparked remarkable job creation and productivity gains, it also has spawned painful income disparities. The bulk of Freeman’s book focuses on the dark side and makes a reader wonder if economic inequities could undermine public faith in U.S. democracy.

Freeman aims to keep the dynamism but spread the wealth. He writes that the rise of a global economy and the emerging worldwide labor markets it has created are putting downward pressure on U.S. wages in more and more sectors. He notes the consequences of the decline of unionism and workers’ corresponding loss of workplace influence. Looking at European precedents, he calls for extending collective bargaining settlements to non-unionized firms through a new form of worker association. He calls for a licensing system for corporate board members as a means to rein in boards that are so loyal to chief executive officers that they approve top executive pay scales derived from astronomy. And he wants a federal agency to push for employee ownership and workforce profit-sharing. The old left would call these measures at best half-hearted; conservatives will denounce them as destructive of the free labor market that is central to U.S. productivity growth.

At heart, though, Freeman embraces growth economics and economist Robert Solow’s teaching that technological and related innovations create the vast share of economic growth. To keep the dynamism but mitigate its effects, there is no substitute for growth; to share more of the pie, there will have to be an expanding pie. The problem for Freeman is not continuing productivity gains but how to distribute the benefits of those gains more broadly. His formula is a familiar one from growth economics: Bolster R&D funding and increase the pool of research scientists and engineers through a new system of financial incentives.

Let’s now return to the economic side of Cicerone’s comment. Why is Freeman arguing that economic growth demands growing the science talent base? This, after all, is an argument that is now widely accepted. Brain scientist Steven Pinker recently called the U.S. failure during the past 20 years to increase scientific talent “unilateral competitive disarmament.” Some 50 major reports from industry, government, and academia since 2002 have reached similar conclusions. In the world of white papers, 50 is a raging torrent. On May 1, 2007, the U.S. Senate, in a rare moment of bipartisan concurrence, voted 88 to 8 for legislation that follows Freeman’s prescription: Raise R&D investment and spend billions on science and math education to expand the nation’s supply of scientific talent. The House has embarked on a parallel path; on May 21, 2007, it passed a similar package of bills on its suspension calendar because there was so little dissent that a formal vote wasn’t needed. Freeman’s supposition is approaching common knowledge. But why will growing science talent grow an economy?

Freeman answers by pointing to a case study, China, which seems to think the question is settled. In the old North-South world economy model, advanced countries with highly skilled workers, led by scientists and technologists, produced cutting-edge innovations, whereas developing countries produced low-technology products. The North’s high-tech monopoly commanded monopoly-like rents and therefore high wages for its skilled workers. Freeman argues that this North-South model is ending because nations such as China and India have figured out that developed countries are not the only ones that can have the skilled technical workforce needed to compete for innovation-led growth. Lower-income countries with large, poorly educated populations can nonetheless graduate large absolute numbers of scientists and engineers. He notes that growth is not tied simply to the number of scientists and engineers; it is tied to the number working on innovation problems. There has to be R&D as well as education. He follows economist Paul Romer’s dictum that growth isn’t causally linked just to human capital; it is human capital engaged in research. The nation that finds the most gold will be the one that fields the largest number of well-trained prospectors engaged in prospecting.

Freeman uses the phrase “human resource leapfrogging” to describe the process of moving up the technological innovation ladder by deploying large numbers of scientists and engineers engaged in technology. This approach uses scientific and technical talent to leapfrog from low-tech into high-tech and then into comparative economic advantage. Because China and India both have large low-wage workforces and large numbers of highly educated workers engaged in technology, they can leverage this low-cost/hightech combination to become powerful competitors to established advanced technology countries. Freeman notes that China is embarked on exactly this strategy: rapidly educating growing numbers of researchers, battling to improve education quality and create first-class universities, and multiplying R&D investment to engage that new talent. He acknowledges that although China has a long way to go in fulfilling this design, we have seen enough of its strategy and its corresponding growth curve to know that it is working. Like economist Paul Samuelson, Freeman concludes that comparative advantage in innovation-based goods and services, unlike comparative advantage in natural resources, is temporary; it can be seized by new innovators in the relentless pace of disruptive and destructive capitalism.

What is the proper response? Because a county like China has such vast numbers in poverty, it will be many decades before it moves to anything like wage parity with the developed world. This makes for a radically more complicated competition than the United States faced with Japan and Germany, fellow high-wage nations, in the 1980s and 1990s. Now that an information technology–enabled global labor market is developing, downward pressure on U.S. wages will only grow. The only response, Freeman argues, is to innovate. “The challenge to U.S. policy-makers and firms is to invest in science and technology so that the country maintains comparative advantage in enough high-tech areas to keep it in the forefront of the world economy in the face of low-wage competitors,” he writes.

LIKE ECONOMIST PAUL SAMUELSON, FREEMAN CONCLUDES THAT COMPARATIVE ADVANTAGE IN INNOVATION-BASED GOODS AND SERVICES, UNLIKE COMPARATIVE ADVANTAGE IN NATURAL RESOURCES, IS TEMPORARY.

The ties between the success of U.S. economic well-being and the success of its democracy have always been strong; U.S. democracy has long had a deep embrace of opportunity. Freeman’s answer to the question the lawyers posed to Ralph Cicerone seems to be that if we want to keep a robust democracy, we will have to keep a strong economy as well; as Cicerone suggested, he sees economic opportunity as an anchor of democracy. Freeman argues that the size of our science talent base will have a lot to do with both.

This isn’t the usual economics tome, packed with neoclassical economic formulae that make the dismal science a dismal read. Freeman writes for a general but informed audience; the book’s points are built around data so that it has heft, not just argument, and it is written in a lively, succinct, clear-headed, and highly graspable style. Some will disagree with Freeman’s grim pictures of disparity, and many with his brief set of safety-net policy prescriptions, but his question of how to keep an advanced technological society advancing and how to spread the gains from its advance will have to be reckoned with.

How the Internet Got Its Groove

Where did the Internet come from? Why has it affected society as it has? These questions have prompted several books over the past few years, books that have celebrated the technologists of the 1960s and 1970s, the observations of trend-spotting social scientists beginning in the 1980s, or the pioneering entrepreneurs of the 1990s. A more global view has been missing, and From Counterculture to Cyberculture aims to provide one.

From Counterculture to Cyberculture is a timely, thoughtful, and eccentric contribution to the growing literature on the Internet and its effects. Weaving together strands of U.S. social history during the second half of the 20th century, Stanford University’s Fred Turner essentially presents an argument about the relevance of the Internet by emphasizing its connection to the generation that made “relevance” the touchstone for cultural value.

Turner puts a spotlight on the curious intersection of a few mid–20th century intellectual trends: the emergence of computers and the field of computer science; the strategies of large organizations (the military and corporations, which were the early adopters of computers); and the values of the 1960s counterculture, which turned its back on these established institutions and on computers. He links Norbert Weiner’s systems theory with Jay Forrester’s cybernetics, which extends systems theory to communication and control in a range of contexts, describing how their core ideas were disseminated outside of the scientific community through gatherings and publications. In turn, he relates systems theory and cybernetics to the more accessible ideas of architect Buckminster Fuller and media analyst Marshall McLuhan, who characterized the social role and effects of ways of connecting ideas and people and informed the zeitgeist of the counterculture. Turner argues that networking—the connection and interconnection of the tangible and the intangible —has deep roots and broad reach as a mode of thought. This mode of thought long preceded, yet set the stage for, the rapid growth of computer networking in the 1980s (in private enclaves) and 1990s (in increasingly public Internet-based contexts). In his view of history, scientists, engineers, and public intellectuals formulated ideas that were carried forward by pundits and other popularizers who lacked gravitas but excelled at communicating.


Central to From Counterculture to Cyberculture is the curious path of counterculture icon Stewart Brand. Turner depicts Brand as someone who has embodied as well as thought about networking since the 1960s, describing how he learned and thought about systems theory and related concepts and how his various projects fundamentally involved connecting ideas and people. For Turner, Brand has been a one-man network. Without fanfare or broad recognition, Brand has provided or stimulated the intellectual cross-pollination of an evolving set of groups, from 1960s communes to 1980s corporations and 1990s Internet startups. Unlike the heroes of typical Internet histories, Brand’s role is social rather than technical. He does networking, and he finds in computer networks the latest in a series of socially useful tools.

Brand’s career and the associated history of information technology are presented as illustrating an idea often ascribed to McLuhan: that we shape our tools and then they shape us. Turner evokes that idea in describing the Whole Earth Catalog, Brand’s idiosyncratic encyclopedia of interesting and practical tools of value to those living in communes, along with contemporary counterculture events that made use of multimedia tools as performance elements. The tool concept is carried forward in the discussion of computers, the Whole Earth ’Lectronic Link (The WELL, the online meeting place that Brand helped establish in 1985), and even the Global Business Network consultancy co-founded by Brand.

Turner uses a specific kind of tool— text—to show the importance of language and rhetoric in image-making and opinion-shaping, key aspects in the rise first of the counterculture and then of cyberculture. Throughout the book, he makes a scholarly case by invoking and citing texts as sources, beginning by using the language of certain intellectuals to make his case for their influence on both counterculture and cyberculture. Though stimulating, this argument is not always convincing. Although the thinkers and ideas he cites were of seminal importance in some circles, it is not clear how widely they were read or how the extent of their influence could be measured, apart from the occasional explicit reflection on them by Brand or another key figure. Turner draws on popular works, such as Ken Kesey’s One Flew Over the Cuckoo’s Nest and Tom Wolfe’s The Electric Kool-Aid Acid Test, to bring the 1960s and 1970s back to life, as well as on Brand’s private and public writing from the 1960s through the 1990s. Turner also seeks to establish the links that connect these key texts; for example, one of the many historical threads traces from the Whole Earth Catalog of the 1960s to the early years of Wired magazine in the 1990s.

Although Brand’s text ventures sometimes struggled (a notable failure, The Whole Earth Software Catalog, focused on software, which proved too dynamic for a periodical), the success of Wired illustrates the durability of printed text. The story of Brand and his ventures also illustrates the enduring value of face-to-face interactions; neither communications networks nor circulating text were sufficient to sustain the flow of ideas and their transformation into action of different kinds. Turner’s tale makes frequent mention of people getting together at scales large and small and the consequences of those interactions. One reason why get-togethers may have been so important is the variety of people and perspectives linked by Turner to the culture behind the diffusion of information technology in general and the ascendance of the Internet in particular—to cyberculture.

NOTWITHSTANDING HIS TALENTS AND VAST PERSONAL NETWORKS, BRAND HAS NO MORE BEEN THE MOST CENTRAL FIGURE IN THE RISE OF THE SO-CALLED NEW ECONOMY THAN ANY OF THE OTHER HEROES ADVANCED BY OTHER AUTHORS OF INTERNETRELATED CHRONICLES.

From Counterculture to Cyberculture makes broad statements about cyberculture, but it is selective. It revolves around one man, Brand, who moves around the country through a series of ventures and encounters. Yet, notwithstanding his talents and vast personal networks, Brand has no more been the most central figure in the rise of the so-called new economy than any of the other heroes advanced by other authors of Internet-related chronicles. In addition to assigning too much significance to Brand, From Counterculture to Cyberculture focuses too exclusively on the West. For example, the key face-to-face interactions in the 1980s and 1990s described in the book tend to occur on the West Coast, especially in the Bay Area, and others are elsewhere in the West (such as New Mexico). The Western bent seems consistent with another aspect of Turner’s selectivity: the characterization of the nature and role of government. The key 1990s political figure in From Counterculture to Cyberculture is Newt Gingrich, who led the Republican revolution in Congress in the early to mid-1990s, the period in which the Internet emerged on the public scene. Clearly, Gingrich’s politics fit the libertarian theme Turner uses as one way to connect the 1960s counterculture to the later cyberculture. But the almost complete neglect of the role of Senator–turned–Vice President Al Gore and the early Clinton administration emphasis on information infrastructure, beginning well before Gingrich became House speaker and infotech cheerleader, seems to sacrifice history to an effort to tell a coherent story. For all of its ponderousness, the Clinton administration’s Information Infrastructure Task Force, associated private-sector advisory committee, and electronic commerce initiative composed an evangelizing force instigating discussions (and writing) across the country and even internationally. These discussions were as influential as Wired in the mid-1990s, promoting discussion of the Internet and its uses and impacts and ideas for new telecommunications legislation. Their absence from From Counterculture to Cyberculture is one reason why the book’s treatment of the 1990s seems particularly thin.

One of the East Coast entities that Turner does address is the Massachusetts Institute of Technology’s (MIT’s) Media Lab, about which Brand wrote a popular book in the late 1980s. It is an important selection, because the lab focuses on innovations in and creative uses of tools, unlike MIT’s (since renamed) Laboratory for Computer Science, which focuses more on creating fundamental information technology concepts and systems. Turner shares the sizzle that the Media Lab and its charismatic leader Nicholas Negroponte, an early backer of and contributor to Wired, are known for. But perhaps because the book seems to end at the turn of the century, it does not address the difficulties that the Media Lab has had in sustaining a viable operating model. Doing so might have complemented the acknowledgement of challenges faced by Wired and motivated more reflection on the limits of cyberculture, at least the aspects that may be most closely linked to counterculture veterans.

Turner is explicit about one selective element in his history: the focus on well-educated and financially comfortable white American males. Given that characterization, and abetted by the occasional quotations from women or the discussion of one exceptional woman, Esther Dyson, the reader wonders what was happening outside of the fraternity. From Counterculture to Cyberculture invites, implicitly, a history of cyberculture for the rest of us— women, Americans of color, and people in different parts of the country and the world. After all, cyberculture is global in all senses of the word and is increasingly a matter of interest for the whole of Earth’s population. In the end, Turner’s portrait of Stewart Brand, his friends, and his work proves provincial, but it nevertheless is an intriguing and thought-provoking tale.

Archives – Summer 2007

SUZANNE ANKER, Laboratory Life, Digital print edition of 46 with 5 artist’s proofs, 13 x 19 inches, 2007.

Laboratory Life

Suzanne Anker, who served as moderator for the recent online symposium Visual Culture and Bio-Science, is a visual artist and theorist working with genetic imagery. She is the coauthor of The Molecular Gaze: Art in the Genetic Age (Cold Spring Harbor Laboratory Press, 2004) and was curator of Gene Culture: Molecular Metaphor in Contemporary Art (Fordham University, 1994), the first exhibition devoted entirely to the intersection of art and genetics. Anker teaches art history and theory at the School of Visual Arts, New York, where she is chair and editor of ArtLab23. She is also the host of BioBlurb on WPS1 Art Radio.

Laboratory Life brings together the scientific laboratory and the artist’s studio. As an ode to the osmotic membrane of what was once a nature/culture divide, this image reflects the ways nature and culture now intersect. The laboratory pictured here is located at the European Molecular Biology Laboratory just outside of Rome, Italy. The superimposed image of grass denotes the ever-changing cycle of renewal in the natural world. Combining these images creates an atmosphere in which aesthetic devices underscore embedded aspects of reason within the scientific realm.

The print was commissioned by the National Academy of Sciences in conjuction with the online symposium Visual Culture and Bio-Science (March 2007).

To view the transcripts of the online symposium, visit www.visualcultureandbioscience.org.

No model for policymaking

Technical solutions have been found for many complicated problems of environmental science. For example, enormous challenges have been overcome to deploy and maintain networks of sophisticated Earth-observing satellites that provide rich global perspectives on environmental change. Complicated problems can be broken down into sequences of smaller, tractable problems that involve predictable and controllable components. A solution that works for one complicated problem will work, with small adjustments, for a similar complicated problem; once one satellite is in place, many of the same approaches can be used for the next one. Through sequential solutions of complicated problems, technology has greatly improved human well-being in the past and will continue to do so in the future.

Many environmental problems, though, are beyond complicated: They are complex. Examples include global climate change; the sustainable mitigation of poverty; and managing tradeoffs among interacting ecosystem services such as food, fresh water, and wild living resources. Such problems self-organize from the interactions of trillions of organisms and decisions by millions of people in a changing world of turbulent atmosphere, ocean, and earth-surface dynamics. Successful solution in one place or time does not guarantee success elsewhere or in the future. Apparently successful solutions seem to sow the seeds of future failures. Prediction and control, the keys to solving complicated problems, fail in complex settings for several reasons, including lack of essential information, nonlinear dynamics, and human volition.
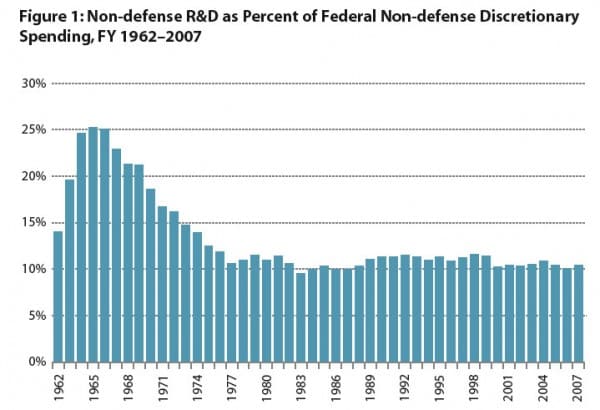
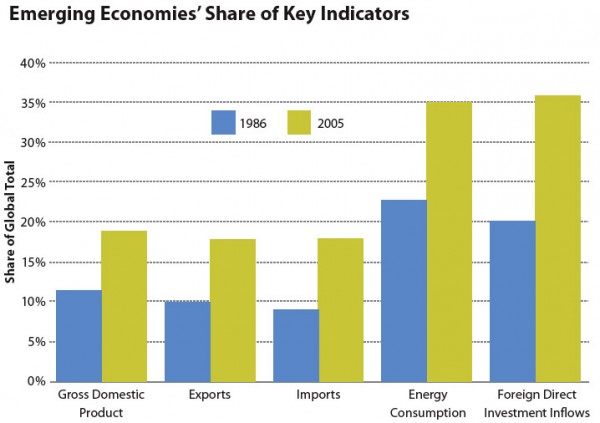
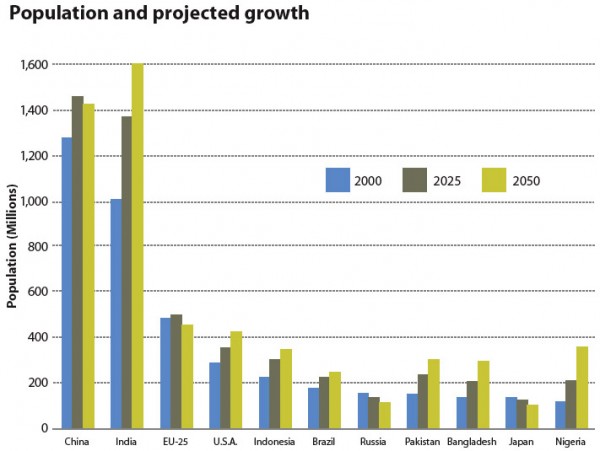
Complex problems must be faced with great humility because control is limited and predictions are unreliable. Yet predictions, however fraudulent, can have enormous economic and political influence if they are taken seriously by society. In this concise, powerful, and readable book, Orrin Pilkey and Linda Pilkey-Jarvis expose abuses of prediction in environmental decision-making. Their specific target is abstruse computer models used by private organizations or government agencies aiming to create spurious certainty, suppress alternative approaches, and influence public policy to reward narrow interest groups. Thus abuses that would be mere hubris if committed by an individual become sociopathic. The models are not designed to shed light on a problem but to create a politically advantageous shortcut to a self-interested outcome.

The book’s sharp critique might turn away some engineers and scientists who appreciate the value of computer modeling. That would be unfortunate, because the argument merits careful consideration. In their last chapter, the authors sharpen the focus of their attack to political misuse of elaborate computer models applied to complex problems. They acknowledge the many successful uses of such models to solve complicated problems of engineering, and the many valid uses of models in basic scientific research. Their beef is with the assertion that the models can resolve complex problems. The boundary between complicated and complex problems is neither precise nor static; it changes continually as society, science, and technology evolve. Thus, the authors argue that the proper uses of models in public policy need to be carefully considered by all environmental scientists.

The strongest chapters of the book address coastal engineering. Beach dynamics are richly dynamic on multiple scales. Local change depends on input-output balances of sand, which have deceptively complex relationships to underwater topography, wind, and currents. Measurements are easily made during calm weather, but these have little relevance to events during storms, when the massive, important changes occur. The authors show how oversimplified models have been applied repeatedly in schemes for beach nourishment or shoreline stabilization that turn coastal developments into accidents waiting to happen.

Modeling concrete and steel for bridges, dams, and elevated water towers is relatively easy. There are few surprises and the designs incorporate large safety factors, so failures are few. Modeling beaches, on the other hand, is very different. They are complex systems that operate under the control of many variables, which are often poorly understood. The various parameters involved in creating beach change work simultaneously and in unpredictable order, timing, and magnitude. There are many surprises. No one knows when the next storm will happen by, and this fact alone wreaks havoc on the neat and orderly world of mathematics at the shore.

Presumably the failed coastal developments enrich a few people while offloading the costs on others, although this social context is not developed in detail in the book. Case studies of open-pit mining reveal similar histories of failure in a situation where the economics are simpler.

Yet in other cases models are used more successfully. Climate change scenarios use enormous computer models, but here the social setting is different in important ways. The models, though complicated, are openly discussed and continually improved and reevaluated by a global community of scientists. The models are only a part of the body of evidence for climate change, which also involves direct measurements of climate and the atmosphere, trends in sea ice and lake ice, natural archives in ice or sediment, and many other sources. For the public and decisionmakers, the models may be almost invisible: One picture of a polar bear on a melting ice floe is worth a thousand computer runs. Pilkey and Pilkey-Jarvis also praise the transparent, open use of models in other areas of public policy such as the management of invasive species.

Though Useless Arithmetic is a compelling assessment of model abuse in environmental science, it is less successful in pointing to solutions. The authors draw a distinction between quantitative and qualitative models, and they link abuses to the quantitative ones. The distinction seems irrelevant and vague. The difficulty is not the models but the context in which they are used.

Uncertainty is not an intrinsic property of nature; it emerges from the problems that society faces and the institutions and intellectual tools (including models) used to address them. The abuses deplored by Pilkey and Pilkey-Jarvis all involve the false narrowing of uncertainty. This occurs when political processes use opaque models to close off alternatives and limit public debate. However, other political processes do the opposite. Global assessments such as the Intergovernmental Panel on Climate Change and the Millennium Ecosystem Assessment, as well as regional programs of adaptive ecosystem management, have used scenarios to embrace diverse models and perspectives. The hope is that fair decisions can emerge if all perspectives and biases are represented and the data and models are transparent and widely shared. By addressing a wide range of viewpoints and models, these processes evaluate information and uncertainty in ways directly pertinent to the social issue. An inclusive political process shapes the scientific assessment.

The harmonization of politics and science is an infinite game, always evolving and never evolved. Any game can involve good and bad moves. Useless Arithmetic is about a type of bad move, in which models are used in politics to overstate certainty and thereby achieve the goals of a narrow interest group. Scientists and engineers need to understand this challenge and help to avoid it. This engaging introduction from Pilkey and Pilkey-Jarvis is a good place to start. The text is clear, direct, and the right length for an airplane trip. Useless Arithmetic should be read widely, but readers will need to look to other sources to learn how institutions and politics can use science more appropriately to improve the general welfare.

The Promise of Data-Driven Policymaking

During the past decade, advances in information technology have ignited a revolution in decisionmaking, from business to sports to policing. Previously, decisions in these areas had been heavily influenced by factors other than empirical evidence, including personal experience or observation, instinct, hype, and dogma or belief. The ability to collect and analyze large amounts of data, however, has allowed decisionmakers to cut through these potential distortions to discover what really works.

In the corporate sector, a wide variety of data-driven approaches are now in place to boost profits, including systems to improve performance and reliability, evaluate the success of advertising campaigns, and determine optimal price. Marriot International, for example, has created a program called Total Hotel Optimization that uses data to shape customer promotions and set prices on rooms, conference facilities, and catering.

In Major League Baseball, the scouting departments of some of the most successful teams are stocked with statistical experts who crunch numbers to determine which players to draft and sign. As described in Michael Lewis’s Moneyball, Oakland A’s General Manager Billy Beane relied on statistical analysis to build one of baseball’s most winning teams while maintaining one of the lowest payrolls.

Data-driven policing took hold in the mid-1990s when the New York City Police Department put in place a computerized system, called CompStat, to track and map crime by neighborhood, allowing the department to more effectively deploy its resources. Under this system, which has been replicated in dozens of cities, the city’s murder rate plummeted almost 70%, well above national averages.

A similar revolution in government decisionmaking is waiting to be unleashed. Policymaking, as it currently stands, can be like driving through a dense fog in the middle of the night. Large data gaps make it difficult to see problems clearly and chart a course forward. In education, for example, we lack basic classroom data that could be used to deploy highly effective teachers where they are needed most. In health care, we are unable to systematically draw comparisons across providers to identify the most effective approaches and most needed investments. And in the environmental arena, basic data on air and water pollution as well as chemical exposures are often unavailable, impairing our ability to prevent public harm.

In a paper-based world, the requisite information was virtually impossible to generate. The costs and administrative burden associated with data collection and analysis were simply too steep. As the corporate sector is demonstrating, however, these barriers have now been substantially reduced. New information technologies make possible—and affordable—a series of monitoring opportunities, data exchanges, analytical inquiries, policy evaluations, and performance comparisons that would have been impossible even a few years ago.

By more effectively harnessing these technologies, government can begin to close data gaps that have long impeded effective policymaking. As problems are illuminated, policy-making can become more targeted, with attention appropriately and efficiently directed; more tailored, so that responses fit divergent needs; more nimble, able to adjust quickly to changing circumstances; and more experimental, with real-time testing of how problems respond to different strategies. Building such a data-driven government will require sustained leadership and investment, but it is now within our reach.

From the greenhouse gas emissions causing climate change to the particulates linked to rising childhood asthma, many of today’s most vexing environmental problems cannot be seen. Likewise, without good data, it is difficult to tease out the multiple elements that turn failing schools into successful ones or identify the factors that cause some hospitals to outperform others. New technologies for data collection, analysis, and dissemination provide the opportunity to make the invisible visible, the intangible tangible, and the complex manageable.

Previously, data had to be reported on paper to government and then entered by hand into a database. This slow and painstaking process severely constrained data collection and forced decisionmakers to diagnose problems based on an incomplete picture drawn from sometimes years-old and error-ridden data. Today, however, government no longer faces the same imperative to pick and choose what information to collect, thanks to breathtaking advances in information-gathering technologies.

Sensor and satellite technologies provide the ability to collect data remotely—24/7, with no data entry necessary—on almost anything in the physical environment, including air and water quality, the health of ecosystems, traffic flow, and the condition of critical infrastructure, such as roads and bridges. For other types of data, including health care records and student test scores, electronic reporting and management systems can seamlessly and instantaneously transfer and aggregate data and check for errors. These technologies are still underused but if effectively harnessed could be used to build a robust information infrastructure for more precise problem spotlighting.

The ability to quickly process information also enables more responsive government. Currently, government often responds only after public harm—illness, death, and other hardships or crises—is manifest. Real-time data collection, on the other hand, empowers government officials to spot problems in time to take preventive action. In a report on the possibility of a terrorist attack on drinking water supplies, for example, the Government Accountability Office noted that experts it consulted “most strongly supported developing real-time monitoring technologies to quickly detect contaminants in treated drinking water on its way to consumers.”

Knowing that a problem exists is frequently not enough, of course. It may also be necessary to know the problem’s nature and shape to effectively develop solutions. What factors contribute to the problem, including how factors interact with each other and their relative importance? What people or communities are most affected? And what is the trend over time, including projections of future severity?

IN 2003, THE BUSH ADMINISTRATION LAUNCHED A NEW TOOL— THE PERFORMANCE ASSESSMENT RATING TOOL (PART)—TO EVALUATE THE PERFORMANCE OF INDIVIDUAL PROGRAMS IN ALL FEDERAL AGENCIES. BUT PART REVIEWS ARE OPEN TO A GREAT DEAL OF SUBJECTIVE INTERPRETATION AND POTENTIALLY POLITICAL MANIPULATION.

Answering these questions requires careful analysis, again with the help of new information technologies. Relational database and data-warehousing systems allow multiple data sets to be queried at once, providing the opportunity to break down the data silos that are now the rule in federal government. For example, we could fuse pollution data, such as annual toxic releases, with public health data, such as cancer-related deaths, and census data. Such integration would facilitate research to uncover what sort of pollution is causing what sort of health effects in what sort of population.

There are also analytical tools that go beyond simple queries to generate deeper understanding. Geographic information systems (GISs) provide the ability to map and visually overlay multiple data sets. Data-mining systems apply automated algorithms to extract patterns, draw correlations, disentangle issues of causation, and predict future results. Within moments, these tools can generate new knowledge that might take years to uncover manually.

As data are collected and analyzed, they can be shared with the public, opening up the policymaking process. Much more still needs to be done, but government Web sites are starting to provide searchable databases, GISs, and other analytical tools. The public can request databases on CD-ROM, so that data can be reconfigured, repackaged, or merged with other data. Data disseminated electronically empower a broad array of actors—including the press, political opponents of the governing party, academics, nongovernmental organizations, the private sector, and concerned citizens— to uncover problems, develop innovative solutions, and demand results.

Indeed, baseball’s move toward data-driven decision-making was initiated not by teams but by fans using their personal computers to crunch statistics and develop a deeper understanding of the game. Billy Beane latched on to and applied these fans’ ideas. Likewise, those outside government can be a huge asset for policymaking, if given the tools to conduct their own analyses.

The federal government is now only scratching the surface in its use of new technologies to collect, analyze, and disseminate data. Antiquated paper-based recordkeeping still pervades U.S. health care, for example, and industrial facilities still hand-report pollution data, often as estimates of pollution, not precise measurements. Moreover, data sets are almost never fused across federal agencies or even within agencies, and only sometimes are they made searchable through the Internet. As new technologies are put to greater use, a far clearer picture of our problems will emerge, opening the door to more targeted, tailored, and precise policymaking.

In the absence of good data, policymaking frequently relies on intuition, past experience, or expertise, all of which have serious drawbacks. A considerable body of research has demonstrated how emotion, issue framing, cascade effects, and other biases cloud policy judgments. Data allow for cool analysis that can help overcome these biases and achieve better policy results.

Of course, this is not to say that data can provide all the answers. Even as we close data gaps with new technologies, there will always be some issues that are difficult or even impossible to capture quantitatively. Thoughtful analysis and human judgment are required to interpret available data and take account of factors that may not be reflected in the numbers. In addition, values are essential to inform policy choices and will continue, appropriately, to be the subject of political debate.

As gaps in knowledge are closed, however, the zone in which political judgment plays out narrows, facilitating consensus and smarter policymaking. In particular, more refined data allow policymakers to develop responses that are targeted at the most important problems or causal factors, calibrated for disparate impacts, and tailored to meet individualized needs.

Policymaking begins with the setting of priorities. Policymakers may identify an array of problems that should be addressed, but because of resource constraints they may be forced to pick and choose. Often, these choices are made haphazardly. Government does a poor job of justifying and delineating priorities for both regulation and the budget. Why is a regulation being undertaken over other possibilities? Why is the budgetary pie divided the way it is? Data can be used to compare problems by relative severity to more efficiently and equitably allocate attention and resources.

Finding ways to package and unlock raw data is essential to drawing such comparisons. This might be as simple as providing quantitative tables that highlight key information. The National Highway Traffic Safety Administration (NHTSA) does a good job of organizing data on auto fatalities and injuries by state. But it might provide even greater clarity. The city of Charlotte, North Carolina, for example, has developed neighborhood “quality of life” rankings, updated every two years, based on 20 indicators measuring conditions in 173 “neighborhood statistical areas.” These indicators are used to identify and target fragile neighborhoods for revitalization.

A BROADER VISION IS NEEDED TO MODERNIZE AND REVOLUTIONIZE THE FEDERAL GOVERNMENT. TOO OFTEN, TECHNOLOGY DEPLOYMENT, DATA GENERATION, POLICY DEVELOPMENT, AND PERFORMANCE MEASUREMENT ARE PURSUED ALMOST AS SEPARATE ENTERPRISES, WITH LITTLE THOUGHT GIVEN TO HOW THEY CONNECT TO AND SUPPORT EACH OTHER.

Specific problems can be similarly dissected to enable targeted policymaking. A problem may have a number of different causes of varying importance, or factors may interact with each other to mitigate or aggravate a problem. The health consequences of one pollutant, for instance, may be aggravated by another pollutant. Knowing this information allows policymakers to focus efforts on key causal factors.

The shape of a problem and the response required also may shift according to a host of background variables, including differences in geography, local infrastructure, demographic makeup, and even individual people. With refined data and analysis, policies can be directed at those most at risk and tailored to fit individual needs or circumstances. The United Kingdom, for example, is moving to personalize learning by providing teachers with a data-rich picture of each student’s needs, strengths, and interests. This knowledge, assembled through new information technology, can be applied so that students are taught in ways that work best for them. Fine-grained data allow policymakers to manage diversity and respond to individualized needs rather than forcing conformity to a uniform approach or standard.

Even with the best data, policymaking is not an exact science and will rarely be done precisely right the first time. Just as leading companies follow the mantra of continuous improvement, good governance requires a process of ongoing trial and error. Once an initiative is implemented, we need to continuously monitor and measure how it is working and make adjustments for better results.

The federal government took a step in this direction with the Government Performance and Results Act (GPRA) of 1993, which requires each federal agency to regularly set goals by which performance is to be measured. Done well, such goal-setting can clarify choices about how to direct attention and resources, communicate expectations and instill a sense of purpose, and stimulate problem-solving and experimentation to find what works. Frequently, however, agencies focus on outputs (activities performed to achieve a goal) or, worse yet, inputs (such as money spent) rather than outcomes that measure actual real-world improvements.

Outputs and inputs are not unimportant, but it is vital to understand how they interact with outcomes to find the most effective and efficient approaches. The measurement of outputs and inputs in isolation may cause government personnel to focus on the performing of tasks that have little to do with real-world results.

Even when there is commitment to develop outcome-focused goals and measures, there can be significant hurdles. Sometimes it is not clear which metrics to use and how to isolate the influence of a policy from the influence of other factors. If oversimplified or misdirected, performance measurement can create warped perceptions and distorted incentives. Some doctors have reportedly begun to turn away gravely ill patients, for example, to boost their personal fatality ratings provided by the federal government. Careful deliberation is required to ensure that metrics accurately reflect program performance and promote desired outcomes. As issues evolve, new metrics will need to be developed and indicators reconfigured.

In 2003, the Bush administration launched a new tool— the Performance Assessment Rating Tool (PART)—to evaluate the performance of individual programs in all federal agencies, ostensibly to inform the president’s budget decisions. But PART reviews, conducted by the White House Office of Management and Budget, are open to a great deal of subjective interpretation and potentially political manipulation. The Federal Emergency Management Agency’s disaster response and recovery programs, for instance, were scored as “adequate” shortly after gross deficiencies were exposed in the response to Hurricane Katrina.

To be successful, performance evaluation must be transparent, free of political manipulation, and based on credible and easily understood data. With reliable performance data in hand, it is then possible to make necessary adjustments to government programs. Policies that are producing good results should be extended and expanded. Those that are not should be rethought, with resources redeployed.

Key in this is government’s ability to incorporate performance data into the decisionmaking process. Even after federal agencies issue their annual GPRA reports, policymakers seldom take notice or make use of the data. In contrast, under Baltimore’s successful CitiStat system (put in place by then-Mayor Martin O’Malley in 2000 and replicated by at least 11 other U.S. cities) heads of city departments report to City Hall every other week to present updated performance data and answer questions from high-level officials in the mayor’s office, sometimes including the mayor.

The frequency of review sessions keeps city leadership focused on the numbers, so that problems are quickly spotted and addressed. CitiStat is credited with saving Baltimore $350 million since its inception while dramatically improving city programs and services. (The city guarantees, for example, that a pothole will be repaired within 48 hours after receiving a public complaint.) As Maryland’s new governor, O’Malley is now implementing this approach on the state level, as is Washington Governor Christine Gregoire.

The ability to track and apply performance data could deliver enormous benefits at the federal level as well. Building this capacity would not only enhance government’s ability to refine policies and adjust to changing circumstances; it would also allow federal agencies to replace one-size-fits-all rules or standards with flexible approaches that encourage policy competition.

Those responsible for implementation, such as state and local governments, industrial facilities, and schools, could be empowered to develop their own solutions so long as real-world objectives are met. Focusing on results, rather than required tasks, encourages experimentation and innovation while allowing policies to be tailored to local circumstances.

Federal agencies can then promote collective learning by evaluating relative performance among peers and spotlighting the most effective strategies that should be expanded, as well as ineffective strategies that should be avoided. NHTSA, for example, has promoted collective learning among states as one of its primary strategies to increase seatbelt usage. In one case, NHTSA urged and worked with states to replicate North Carolina’s “Click It or Ticket” program, which had achieved significant gains by stepping up the enforcement of seatbelt laws, with particular attention aimed at teens and young adults.

Ranking performance against a relevant peer group provides a particularly strong incentive to address weaknesses and adopt top-performing solutions. No state wants to be identified as a laggard, and all desire recognition for outperforming peers. Performance benchmarking, now done only sporadically, can be used to jump-start a race to the top without any federal command and control.

The idea that government should base its decisions on data, evidence, and rational analysis is not new, of course. What’s new is the opportunity created by information technologies to crystallize problems and highlight effective solutions. This opportunity, however, is still waiting to be seized. Policymaking persists much as it always has, even as technology has raced ahead and decisionmaking is transformed in the corporate sector and other realms.

A broader vision is needed to modernize and revolutionize the federal government. Too often, the various steps discussed above—technology deployment, data generation, policy development, and performance measurement—are pursued almost as separate enterprises, with little thought given to how they connect to and support each other. Bringing these components into a coherent whole is essential to implement data-driven policymaking.

The first order of business in this effort is building a robust information infrastructure. Government decisionmaking currently suffers from persistent data gaps, the lack of systematic analysis, and poor information management and dissemination. Accordingly, information needs must be methodically identified and then addressed through a government-wide strategy to procure and deploy new technologies.

This also should be accompanied by changes in the policymaking process, so that decisionmakers are positioned to capitalize on the information generated. In particular, this means creating systems, such as Baltimore’s CitiStat program, or enhancing existing systems, such as GPRA, to ensure that policymakers regularly consult data to guide decisions and drive real-world results.

Less tangible but equally important is the need to change the way we think about policymaking. Refined data permit more targeted, tailored, and experimental policymaking. Success depends on recognizing these opportunities and devising new approaches to take advantage of them.

Finally, a movement toward data-driven policymaking cannot happen without political leadership. At the federal level, the president and Congress must step up. Getting the dozens of different departments and agencies that make up the federal government to embrace this approach and harmonize efforts where responsibilities overlap will require significant planning, coordination, oversight, and, perhaps most crucially, investment, so that core agency functions are enhanced and not disrupted.

As we break down these barriers, however, we will begin to reap the benefits of a data-driven government that is more effective, efficient, open, and accountable. Let the revolution begin.

Full Disclosure: Using Transparency to Fight Climate Change

Congressional leaders are finally working seriously on long term-approaches to counter climate change. But all the major proposals leave a critical policy gap because they would not take effect for at least five years. Meanwhile, U.S. greenhouse gas emissions continue to increase, and company executives continue to make decisions that lock in the emissions of future power plants, factories, and cars.

Congress could fill that policy gap now by requiring greater transparency. In the immediate future, legislating product labeling and factory reporting of greenhouse gas emissions would make markets work better. Such disclosure would expose inefficiencies and allow investors, business partners, employees, community residents, and consumers to compare cars, air conditioners, lawn mowers, and manufacturing plants. As people factored that information into everyday choices, company executives would have new incentives to cut emissions sooner rather than later. Greater transparency would also help jump start whatever cap-and-trade or other regulatory approach emerges from the current congressional debate. A carefully constructed transparency system is therefore an essential element of U.S. climate change strategy. Such a system would fill a legislative void and provide immediate benefits as Congress continues its debate.

Congress is debating long-term approaches to climate change. Barbara Boxer (D-CA), chair of the Senate Environment and Public Works Committee, and John Dingell (D-MI), chair of the House Energy and Commerce Committee, are holding wide-ranging hearings, and Speaker Nancy Pelosi (DCA) has created a select committee to coordinate climate change action in the House. Three major bills propose variations on a cap-and-trade approach to cutting greenhouse gas emissions. All combine industry emission limits or “caps” with government-created markets for trading emission permits. The bills differ mainly in the progressive severity of caps and in how they are set. The most ambitious proposal, introduced by Boxer and Sen. Bernie Sanders (I-VT), proposes caps that would reduce emissions to 80% below 1990 levels by 2050.

Ironically, though, even if the 110th Congress approves some variation on a cap-and-trade approach, the new law will not create any immediate incentives for manufacturers, power providers, factory farms, and other major contributors to reduce emissions. If President Bush signed such legislation in 2008, his action would only signal the beginning of another debate over the rules that would govern the system. That debate is likely to be long and acrimonious because the fine print of the regulations will determine which companies are the real winners or losers from government action. Regulations will govern the mechanics of trading emission permits, the allocation of “caps” among industries and companies, and the timing of compliance—all costly and contentious issues for energy-intensive businesses.

IN THE IMMEDIATE FUTURE, LEGISLATING PRODUCT LABELING AND FACTORY REPORTING OF GREENHOUSE GAS EMISSIONS WOULD MAKE MARKETS WORK BETTER.

Such delay may be inevitable but its costs will be high. Even conservative projections conclude that U.S. greenhouse gas emissions will continue to increase rapidly during the next decade and will produce increasingly serious consequences. The administration’s latest climate action report, circulated in draft, projects that a 19% increase in emissions between 2000 and 2020 will contribute to persistent drought, coastal flooding, and water shortages in many parts of the country and around the world. That increase could be as high as 30% under a business-as-usual scenario. The U.S. Environmental Protection Agency (EPA) reports that carbon dioxide emissions, the most common greenhouse gas, increased by 20% from 1990 to 2005, and emissions of three more potent fluorinated gases, hydrofluorocarbons, perfluorocompounds, and sulfur hexafluoride, weighted for their relative contribution to climate change, increased by 82.5%. The United States still holds the dubious distinction of being the world’s largest producer of greenhouse gases.

Each large contributor to increasing U.S. greenhouse gas emissions has a unique story. Carbon dioxide emissions from generating electricity, responsible for 41% of total U.S. emissions from fossil fuel combustion in 2005, continue to increase faster than energy use because dramatic increases in the price of natural gas have led some power providers to increase their reliance on coal. The most recent estimates of the federal Energy Information Administration project that such emissions will increase 1.2% a year from 2005 to 2030. (The burning of petroleum and natural gas results in 25% and 45% less carbon emissions per unit respectively than does the burning of coal.) Power companies are investing now in facilities that will shape the next half-century of electricity generation—and the next half-century of greenhouse gas emissions. Many of the more than 100 new coal-fired power plants on the drawing boards will have useful lives of 50 years or more.

Carbon emissions from the incineration of municipal solid waste, not even including paper and yard trimmings, increased 91% from 1990 to 2005 as more plastics, synthetic rubber, and other wastes from petroleum products were burned. Carbon emissions from cement manufacture increased 38% as construction activity increased to meet the demands of the growing U.S. economy. Carbon emissions from the burning of gasoline, diesel fuel, and jet fuel to power cars, trucks, planes, and other forms of transportation increased 32% during the same period because of increased travel and “the stagnation of fuel efficiency across the U.S. vehicle fleet,” according to the EPA.

Executives will need powerful incentives to alter current plans in order to make significant reductions in greenhouse gas emissions any time soon. Most are understandably reluctant to place their companies at a competitive disadvantage by making bold and often costly emission-cutting moves unilaterally. In fact, the prolonged congressional debate may make executives more reluctant to act early since their companies may reap large emission-cutting credits once regulations take effect. So far, neither the administration nor Congress has come up with any way to reduce greenhouse gas emissions in the next critical years.

A carefully constructed transparency system would mobilize the power of public opinion, inform choice, and help markets work better now. Requiring disclosure for each proposed and existing major factory and power plant as well as for each new car, truck, furnace, refrigerator, and other energy-intensive product would expose their relative carbon efficiencies as well as their total contributions to such emissions.

Once disclosed, emissions data could be used by mayors and governors to design and carry out emission-reduction plans; by local zoning and permitting authorities to place conditions on the construction or alteration of plants; by investors to more accurately predict material risks; by consumers to choose among cars, air conditioners, and heating systems; and by employees to decide where they want to work. Environmental groups, industry associations, and local and national media could use the information to help to pinpoint the most inefficient factories and cars.

Equally important, shining a light on factory and product emissions would allow chief executive officers (CEOs) and their business partners and competitors to see for the first time their relative efficiency and to put pressure on bad actors. Requiring CEOs to sign off on annual reports would ensure that that information worked its way to the top of the managerial ladder. The collective effect of new information and changed choices would create incentives for managers to take feasible steps toward reducing greenhouse gas emissions sooner rather than later.

Requiring such reporting is politically feasible. A transparency requirement could break the political logjam that has held up climate change legislation in Congress. Transparency often has broad appeal to both Democrats and Republicans because it empowers ordinary citizens, strengthens market mechanisms, and allows executives to choose what actions to take in response. Many corporate leaders would support transparency because it would reward companies for reducing emissions early, help them manage their own risk, and provide them with data on which to base their response to a future cap-and-trade requirement.

The critical prerequisites for an effective transparency policy are already in place. That is important because transparency policies do not always work. Public indifference, battles over how to measure progress, or the absence of real opportunities for investors, consumers, or disclosing companies to take meaningful action can turn a well-intentioned policy into a meaningless paperwork exercise. To be effective, transparency policies need consensus metrics, feasible emission reductions, interested consumers of information who have real choices, and the support of at least some disclosing companies able to improve products and practices.

Metrics for measuring greenhouse gas emissions are good enough to support a disclosure system and will get better. An internationally accepted protocol to measure and report emissions has been tested in a variety of real-world settings including markets such as the European Union’s cap-and-trade system, the Chicago Climate Exchange, and California’s greenhouse gas registry. A new profession of auditors has already emerged to certify the accuracy of company reporting of such emissions.

There are signs that key groups are ready to weigh emissions in making routine decisions. Investors have shown increasing interest in factoring into their stock purchases risks associated with climate change. AIG, Goldman Sachs, and other U.S. investment firms support a London-based carbon disclosure project that aims to meet the needs of institutional investors for information about company emissions. The project is supported by 280 investment groups with assets of more than $41 trillion, according to the project’s Web site. In 2005 and 2006, climate change issues also produced the largest number of nonfinancial shareholder resolutions in the United States. Executives of the California Public Employees’ Retirement System, one of the nation’s largest pension funds, said that they supported such resolutions at General Motors and Ford in order to improve the transparency of environmental data.

Leading U.S. corporations already preach the benefits of transparency, and some have sought competitive advantage by voluntarily disclosing company-level emissions. A coalition of firms and environmental groups that includes General Electric, Alcoa, Duke Energy, Environmental Defense, the Natural Resources Defense Council, and the World Resources Institute in a climate-action partnership has recommended the creation of a national registry of greenhouse gas emissions. Wal-Mart, Home Depot, Boeing, American Express, and other large U.S. companies have joined the London-based carbon-disclosure project. Likewise, state governments and consumers have shown increasing interest in greater transparency. In May of this year, a group of 31 states launched a multistate greenhouse gas registry to which companies, utilities, and government can voluntarily report their emissions.

A few companies in the United States and Europe have undertaken costly carbon labeling of products, banking on the idea that consumers care enough about such emissions that reporting low emissions will boost sales. Footwear manufacturer Timberland recently assigned “green index” ratings to shoes that report the amount of greenhouse gases released in their production. In the United Kingdom, the supermarket chain Tesco is launching labels that specify the carbon footprint of thousands of its products and reports that it will spend nearly $1 billion over the next five years to stimulate “green consumption.” The Carbon Trust, an organization funded by the British government to help businesses reduce their carbon emissions, is helping companies devise carbon labels for brand-name products such as Walkers snacks and Boots shampoos. The British government recently unveiled a plan to develop standard metrics for greenhouse gas emissions of products and services as a first step towards a green labeling system that would guide consumers’ and businesses’ choices. In the United States, polls show broad public concern about climate change: 90% of Democrats, 80% of independents, and 60% of Republicans favor immediate government action, according to a New York Times/CBS poll released in April 2007.

Members of Congress are beginning to heed demands for better information. A recent proposal by Senators Amy Klobuchar (D-MN) and Olympia Snowe (R-ME) would add greenhouse gases to the factory-by-factory toxic chemical disclosure requirement.

Reducing emissions is also feasible. Although some substantial cuts in greenhouse gas emissions must await technological advances, others can be achieved with existing technology, as European companies, now subject to cap-and-trade restrictions, have demonstrated. For example, British Petroleum, the world’s third-largest oil company, cut carbon emissions by 10% between 1998 and 2002 by introducing new energy-efficiency measures and by creating an internal emissions-trading scheme among its 150 business units in more than 100 countries.

Government action is needed. Voluntary disclosure will not create incentives for broad emissions reductions for three reasons. It does not allow investors, employees, or consumers to compare all major products and facilities. It cannot assure standardized metrics. And it cannot provide enforcement to ensure that reporting is accurate and complete. As state and private initiatives multiply, only a national reporting requirement can level the playing field for disclosers by ensuring consistent reporting. When public risks are serious, legislated transparency offers the permanence, legitimacy, and accountability that increase the chances that disclosed information will truly serve policy priorities.

Likewise, disclosure of company-level emissions, rather than disaggregated factory and product emissions, is not enough. When companies have dozens and sometimes hundreds of business lines, the reporting of total emissions does not give consumers and investors the information they need to discern relative efficiencies and trends and to incorporate new information into decisions.

A time-tested policy tool

The power of transparency has worked in the past to reduce harmful pollution. After a disastrous chemical accident at a pesticide plant in Bhopal, India, in 1984, killed 2,000 people, Congress required U.S. companies to disclose their toxic emissions factory by factory and chemical by chemical. When they saw the first numbers, shamefaced executives promised immediate reductions. CEOs of Monsanto, Dow Chemical, IBM, and other major companies made commitments to cut toxic pollution by as much as 90% within a few years. The EPA later credited that simple disclosure requirement with reducing reported toxic pollution by as much as half in the 1990s. Both positive and negative lessons learned from toxic chemical disclosure can provide a template for structuring transparency to reduce greenhouse gas emissions.

Using transparency requirements to reduce public risks is no longer unusual. In recent years, Congress has frequently constructed transparency systems to reduce specific health, safety, and environmental risks. In addition to toxic pollution reporting, automobile safety ratings, nutritional labels, drinking water quality reports, workplace hazards reporting, and dozens of other laws have been enacted in recent years that aim to create specific incentives for companies to improve their products and practices. At best, such policies mobilize market forces and empower the choices of consumers, investors, employees, and business partners with relatively light-handed government intervention.

In fact, the United States has fallen behind other countries by not requiring factory reporting of greenhouse gas emissions. Plants in the European Union have been required to disclose their greenhouse gas emissions since 2000 as part of a larger pollution-reporting system. Energy, metals, minerals, chemicals, waste management, paper, and other major industries report emissions if they rise above certain thresholds under guidelines set up by each nation. Reports are aggregated in a user-friendly European Pollutant Emission Register (EPER) Web site. Citizens can search at by inserting a factory name and greenhouse gas, or by placing their cursor on a geographical area of interest and zooming in. They can compare emissions from different factories, view satellite images of factories, and find out whom to contact.

The European Union’s (EU’s) reporting requirements have become more rigorous over time, suggesting that greater transparency is gaining broad support. At first, the EU required reporting every three years (2001 and 2004 data are available), but now requires annual reporting. It has also expanded the scope of reporting to disclose more sources of emissions, including road traffic, aviation, shipping, and agriculture. Early evidence suggests that EPER information is used by local and national administrators, businesses, environmental groups, and the public at large. Factories are also required to report their carbon emissions under the EU’s cap-and-trade system, launched in 2005, in order to verify emission levels and administer allowances. Those reports are available at http://ec.europa.eu/environment/ets/.

The EU also mandates the disclosure of carbon dioxide emissions and fuel consumption by car model in order to inform consumers’ choices. Car dealers are required to feature this information in their showrooms, either on posters or Web sites, and to post rankings of their car models by carbon emissions, with greener models at the top of the list. Some countries aggregate this information on Web sites. The UK Vehicle Certification Agency, www.vcacarfueldata.org.uk, provides an example. European subsidiaries of U.S. companies are already required to report factory and automobile emissions under these rules.

The United States’ closest neighbors are also moving ahead in requiring factory reporting of greenhouse gas emissions. In 2004, Canada began requiring large contributors to greenhouse gases (factories that produce more than 100,000 tons of greenhouse gas) to disclose emissions every year. Additional factories have reported voluntarily. In 2001, Mexico required electronic disclosure of greenhouse gases by factory and chemical, with results available at . Cement companies, several iron and steel companies, and the nationalized oil and gas company Pemex also report under a voluntary program that was launched to provide company-level data while the mechanics of required disclosure were being worked out.

TO BE FACTORED IN TO EVERYDAY DECISIONMAKING ROUTINES, INFORMATION MUST BE PROVIDED AT A TIME AND PLACE AND IN A STANDARDIZED FORMAT THAT ENCOURAGES ITS USE BY COMPANIES, INVESTORS, CUSTOMERS, BUSINESS PARTNERS, AND THE PUBLIC AT LARGE.

How would factory and product disclosure lead to reductions in greenhouse gas emissions? Transparency policies rely on a fortuitous chain of reaction. Managers of companies whose products or processes are large contributors to greenhouse gas emissions disclose those emissions using standardized metrics. Consumers, investors, job seekers, community residents, and government officials use that information to make decisions about what products to buy, what companies to invest in, where to work, and whether to grant permits to new or expanded businesses in their neighborhoods or cities. Perceiving these changed preferences, executives reassess the costs and benefits of emissions and make whatever reductions they believe would improve their company’s competitive position.

Managers respond to transparency policies for three reasons. First, disclosure requirements sometimes provide information that is new to managers themselves and that suggests opportunities to enter new markets or reduce waste. Managers may see opportunities to develop low-carbon products and services or to employ greenhouse gas wastes in manufacturing, for example. Second, disclosure can create new competitive risks, by reducing demand for carbon-intensive products, for example. Third, disclosure can create new reputational risks and benefits as investors and consumers compare factories and products.

What can go wrong? Transparency policies can fail for many reasons. People often simply do not notice or understand new information. Even when they do notice it, they may not factor it into key decisions. If many consumers and investors do vote with their wallets for lower emissions, companies still may fail to discern the reason for their changed choices. And, of course, even if companies accurately track changes in preferences, they may nonetheless decide not to reduce emissions.

The architecture of transparency is therefore critical to its effectiveness. Principles of effective design can reduce the chances of transparency failure.

  • Provide information that is easy for diverse audiences to use. To be factored into everyday decisionmaking routines, information must be provided at a time and place and in a standardized format that encourage its use by companies, investors, customers, business partners, and the public at large. Emissions information sent to customers with their utility bills, highlighted on product stickers, posted at factory entrances, and featured on company Web sites is accessible; information in government file drawers or complex databases is not. A rating system assigning stars, letter grades, or colors to cars or factories would enable consumers and investors to assess emissions information more readily. User-friendly Web sites maintained by neutral organizations can help ensure that data are available quickly and can be aggregated for fair comparisons. Because each user has different information needs, time demands, and capacity to understand technical terms, Web sites should allow people to compare the emissions and the relative efficiency of factories, power plants, new car models, and heating and cooling systems by asking specific questions.
  • Strengthen groups that represent users’ interests. Advocacy groups, analysts, entrepreneurial politicians, and other representatives of information seekers have incentives to maintain and improve transparency systems. Policymakers can design systems to formally recognize the roles of such user groups in oversight, evaluation, and recommendations for improvement.
  • Design in benefits for disclosing companies. When leading companies perceive benefits from improved transparency, policies are more likely to prove sustainable. Chemical companies aimed to avoid stricter pollution rules and reputational damage and to gain a competitive edge when they drastically reduced toxic pollution in response to new disclosure requirements and sought to broaden requirements to include other disclosers.
  • Match the scope of disclosure to the dimensions of the problem at hand. To be fair and comprehensive, emissions reporting would have to include all major emitters—government agencies as well as companies—for their operations in the United States and abroad. Disclosure of emissions from subsidiaries based outside the United States would prevent the transfer of polluting operations to countries with less transparency and would provide a snapshot of company-wide greenhouse gas emissions that investors could use in their calculations to offset risks. Disclosure should cover stationary facilities and mobile sources and should also include both direct emissions and indirect emissions that result from the use of electricity. It should include both emissions per units of economic output and total tons of greenhouse gases, with a CEO certification of the accuracy of reports to ensure top-level attention.
  • Design metrics for accuracy and comparability.Successful policies feature metrics that are reasonably well matched to policy objectives and allow users to easily compare products or services. Achieving comparability can involve difficult tradeoffs because simplification may erase important nuances and standardization may ignore or discourage innovation. Inevitably, disclosure systems start with imperfect metrics. The important question becomes whether those metrics improve over time. Greenhouse gas metrics are already good enough to support trading markets, and U.S. power plants already report carbon dioxide emissions as part of an established cap-and-trade system for acid rain pollution. Over time, the development of more sophisticated sensors (already used by power plants in the United States for monitoring carbon dioxide emissions) will fine-tune initial estimating techniques.
  • Incorporate analysis and feedback. Transparency systems can grow rigid with age, resulting in a tyranny of outdated benchmarks. Generously funded requirements for periodic analysis, feedback, and policy revision can help keep emissions disclosure supple and promote adaptation to changing circumstances. The National Academy of Sciences or another impartial oversight group could be charged with periodically assessing the fairness and effectiveness of the disclosure requirement and its metrics, and regulators could be required to consider those impartial recommendations.
  • Impose sanctions. Corporations and other organizations usually have many reasons to minimize or distort required disclosures. Information can be costly to produce and even more costly in reputational damage. As a result, substantial fines or other penalties for nonreporting and misreporting are an essential element of successful systems.
  • Strengthen enforcement. Sanctions are not enough, however. Legal penalties must be accompanied by rigorous enforcement to raise the costs of not disclosing or disclosing inaccurately. Building in an audit function is one way to ensure ongoing attention to accurate reporting. The fact that there is still no systematic mechanism for auditing toxic pollution data provided by companies means that no one knows for sure how accurate or complete that data is.
  • Leverage other regulatory systems. The power of transparency is strengthened when it is designed to work in tandem with other government policies. Emissions disclosure can be constructed to reinforce cap-and-trade regulation and possible future carbon taxes, for example. Transparency usually serves as a complement to, rather than a replacement for, other forms of public intervention.

The information wars will continue, of course. There will be struggles over how to measure emissions from dispersed sources such as agriculture and other land-based activities. There will be questions about whether estimates of emissions are good enough and whether or when to use sensors for precise measurements. There will be debates about whether facility and product reporting gives away trade secrets.

Nonetheless, a carefully constructed transparency system is an essential and currently neglected element of an eventual portfolio of U.S. measures to counter climate change. In the near future, it also fills a serious policy gap by providing immediate incentives for reductions of greenhouse gas emissions, in a politically feasible first step.

Forum – Summer 2007

Not enough U.S. engineers?

Vivek Wadhwa, Gary Gereffi, Ben Rissing, and Ryan Ong from Duke University have clearly put a lot of work into their study of engineering education in the United States, India, and China (“Where the Engineers Are,” Issues, Spring 2007). From the perspective of current and future U.S. competitiveness and national security, it is clear that we need to have more studies such as this one. That acknowledged, we have some important reservations regarding their analysis.

First, although the Duke study clarifies some of the problems dealing with inaccurate data related to engineering graduation rates in China and India, the irony is that they too have made a major error in their treatment of the Chinese case. According to the Duke analysis, the official data from China are “suspect” because they were unable to reconcile some key differences in reporting undergraduate engineering graduation rates between China’s Ministry of Education (MOEd) and the China Education and Research Network (CERN). The Duke team therefore concludes that “the CERN numbers are likely to be closer to actual graduation rates” than those from MOEd. However, not only do the CERN numbers come from MOEd, which released them in the China Educational News (a MOEd newspaper), but they included only 56 specialties (out of close to 500) whose new enrollment in 2004 was over 10,000. In other words, Duke’s suspicion is misplaced because they have not interpreted the Chinese data correctly.

Second, the authors highlight the decrease in the number of technical schools and their associated teachers and staff as evidence to support their claims about the weaknesses in the Chinese data. According to their analysis, the number of such schools fell from 4,098 to 2,844 between 1999 and 2004, and the number of teachers and staff fell by 24%. We were surprised by the alleged sharp decline, so we consulted the China Education Statistical Yearbook. It turns out that “technical schools” have nothing to do with higher education, because they enroll graduates from junior high schools. For the record, the total number of Chinese institutions that grant bachelor’s degrees—engineering and others—actually increased from 597 in 1999 to 701 in 2005, according to the China Statistical Yearbook of Education.

Third, the article’s contention that one of the rationales for China to enlarge enrollments in science and engineering education is “to reduce engineering salaries simply” is supported by neither the wage data nor the official policy pronouncements. At no time, either formally or informally, has the Chinese government pointed to that as a specific objective, nor have we heard similar arguments during our extensive field research in China over the past year. The chief rationale behind the enlargement of engineering enrollment in China has been economic: increasing domestic consumption. MOEd officials now recognize that the enlargement has had an unintended consequence; that is, hedging on a projected decrease in China’s college-bound population in the future as suggested by the current Chinese demographic trajectory.

And fourth, based on our own overall successes in securing open-source data from Chinese government agencies and retail booksellers, we are quite uncomfortable with the assertion in the Duke article that “Chinese yearbooks generally are not permitted to leave China.” During our own multi-visit fieldwork in 2006, we purchased numerous volumes of Chinese statistical yearbooks regarding science and technology (S&T) developments, high-tech trends, education development, etc., and have never experienced any trouble bringing out or shipping books back to the United States. Although we have been careful to steer clear of what the Chinese government defines as “neibu,” or internal-use-only materials, we largely have felt unencumbered in searching for data in public libraries and think-tank book collections as well.

Although we appreciate the important contributions of the Duke team, it is clear that these types of studies cannot be conducted without a fuller in-depth understanding of the actual Chinese situation—with all of its achievements and shortcomings, especially with respect to the broad array of statistical materials that exists regarding higher education, the S&T workforce, and population demographics. Indeed, there remain many problems with the quality and reliability of Chinese data; there are many outstanding issues that make comparisons with the countries of the Organization for Economic Cooperation and Development, as well as forecasting and trend analysis, quite challenging. In order to alleviate some of the frustrations that the Duke team and other scholars have encountered in understanding China’s statistics on human resources in S&T, we devote an entire chapter to the topic in our forthcoming book Talent— China’s Emerging Technological Edge (Cambridge University Press).

Finally, in the extensive research project we have conducted at the State University of New York’s Levin Graduate Institute over the past year regarding China’s high-end science and engineering talent pool, we have identified not only the supply-side elements addressed by the Duke team but, most important, also the demand-side variables that seem to be driving the rapidly expanded need for talent among China’s domestic firms and universities as well as foreign corporations and their newly established R&D centers. We believe that our research sets forth a fuller series of explanations for what is actually happening with respect to the current and future availability of science and engineering talent in China.

DENIS FRED SIMON

Provost

CONG CAO

Senior Researcher

Levin Graduate Institute

State University of New York

New York, New York


As observers have pointed out over the years, the “science” of science policy is weak at best. This shortcoming has been particularly obvious in the policy discussion concerning the implications of the globalization of engineering labor, where policy proposals have largely been based on flawed data and no analytical framework. Vivek Wadhwa, Gary Gereffi, Ben Rissing, and Ryan Ong’s article provides some important and grounded contributions, pointing us in the right direction when thinking about these issues.

Their most significant contribution is an analysis of hiring statistics regarding U.S. engineers. Rather than relying on the impressions of company executives, as so many news stories and studies are wont to do, they asked hiring managers to provide objective metrics, such as offer-acceptance rates, signing bonuses, and time to fill positions. Their findings belie the conventional wisdom that there is a persistent shortage of U.S. engineering labor, calling into question the usefulness of doubling the number of engineering graduates: the principal policy response proposed by our leaders, chief executive officer and university president alike. The lesson is that objective data-gathering needs to be extended to the multiple dimensions that influence domestic engineering labor markets: supply, demand, incentives, career durability, pipeline capabilities, wages, employment relations, cost of entry, foreign labor substitution and complements, public mission, etc.

What is also missing in the policy discussion is an analytic framework in which we can evaluate the policy choices. We know that a company will rationally seek the lowest unit cost for all of its production inputs, and that includes engineers. The new reality is that firms, for a variety of reasons (the deterioration in employment relationships in the United States is the most important and overlooked), can choose from a much larger menu of options, domestic, foreign, or imported, when it comes to sourcing engineering talent. This poses a genuine competitiveness challenge for U.S. engineers, whose traditional comparative advantages are eroding fast. The key policy question, given the fundamental changes that globalization is making in the engineering labor market, is how do we make U.S. engineers more competitive? One way to solve this is for domestic engineers to lower their compensation demands and give up workplace and career security, but this doesn’t seem to be a very sensible solution. A better answer is to make U.S. engineers significantly more productive than their foreign competition to justify their wage premiums. This would be the high road to solving the competitiveness challenge for U.S. engineers.

However, we have good theories about how firms compete with one another through lower costs or product differentiation, but our thinking about the dynamics of competition at the occupational level seems to be quite limited. For example, the productivity advantages for engineers practicing in America are not simply derived from a better U.S. engineering education, as so many engineers with foreign training have demonstrated. Instead they come from a more complex set of demand and structural factors. It is those factors we should be exploring in more depth, to formulate our policies and help engineers understand what they need to do to compete. For example, should U.S. engineers crowd into non-tradable jobs, as Alan Blinder’s recent work seems to suggest, or should they be seeking ways in which they can create comparative advantages in tradable activities? With a better understanding of the market dynamics, we can work to get market incentives right and render attempts to centrally plan the number of engineers moot.

RON HIRA

Rochester Institute of Technology

Rochester, New York


First off, I’d like to thank Vivek Wadhwa, Gary Gereffi, Ben Rissing, and Ryan Ong for their important, insightful article. As a technology executive deeply involved in research and recruiting efforts for Microsoft, I can say that our industry is actively engaged in this issue. From our vantage point, the article misses a few key elements that are essential to this broader discussion, particularly that the enrollment into engineering programs has declined, significantly reducing the pipeline of prospective computer science graduates.

The authors look at engineering degree production during a specific time frame to suggest that the current U.S. supply is sufficient. Yet they overlook enrollment, which tells a completely different story over the past few years. For example, the Computing Research Association’s Taulbee Survey on computer science enrollment in the United States shows a decline of 39% since 2001. According to the Higher Education Research Institute/University of California Los Angeles annual Cooperative Institutional Research Program Freshman Survey, the percentage of incoming undergraduates planning to major in computer science declined by 70% between 2000 and 2005.

After six years of decline, the number of new computer science majors in 2006 was 7,798—roughly half of what it was in 2000 (15,958). Granted, these figures represent only computer science as opposed to engineering as a whole, but they do reflect what we believe is a general trend in the United States across the engineering and science disciplines.

This reveals a flaw in the premise of the article when it comes to the supply of engineers: The authors overlooked the 4- to 5-year pipeline between enrollment and degree production. The high number of 2005 degrees issued reflects enrollment in 2000–2001, at the height of the dot-com boom. In contrast, degree production numbers for the next four years have already been determined by enrollment rates such as those cited above, and they are anemic.

This dramatic dropoff in the domestic supply of computer science graduates is one reason why the leadership of the information technology community is sounding an alarm. The picture looks bleak over the next few years.

Although the solution to this worldwide shortage must be global, the U.S. technology industry must take immediate steps at home to get more people into the field. Many of the remedies suggested in the article align with strategies that the industry is currently pursuing: the number of H-1B visas and amount of research funding both need to increase. Green card reform is necessary. The industry and government must find ways to make science and engineering more exciting and rewarding for young undergraduates. And mid-career retraining efforts deserve examination and better funding.

The authors are correct that the answer lies in no single country, incentive, or program. Only by working holistically across disciplines, cultures, and geographies can we continue to fill the talent pipeline that fuels innovation in science and technology across the globe.

RICK RASHID

Senior Vice President

Microsoft Research

Redmond, Washington


Technology evolution in India and China

In “China and India: Emerging Technological Powers” (Issues, Spring 2007), Carl J. Dahlman performs a useful service by calling our attention to the growing scientific and technological capabilities of China and India and by providing a set of statistical indicators for comparing relative performance. Both countries are developing their own national innovation systems but are also becoming important nodes in global networks of research and innovation. The prospects for both countries are enhanced by international cooperative relations with established centers of excellence in the countries of the Organization for Economic Cooperation and Development, relations that are facilitated by the scientific diasporas of Chinese and Indian scientists and engineers to Europe, North America, and to a lesser extent, Japan.

As scientific and technological development in the two countries proceeds, however, their inherited institutions affecting higher education, R&D management, intellectual property protection, and the governance of science and technology (S&T) more generally will be increasingly challenged. Developing the capacity for ongoing institutional reform and innovation, therefore, is likely to pace their emergence as technological powers as much as standard input measures such as R&D spending and the education and employment of scientists and engineers.

For instance, in spite of two decades of institutional reform, the challenges of institutional innovation in China have become more pressing precisely at a time when financial and human resources for S&T have become more abundant and the expectations for R&D have risen. These challenges range from university reforms needed to stimulate greater research creativity in young scientists and engineers to mechanisms for more effective national coordination of research. They also include the need to develop quality-control and evaluation procedures to promote genuinely innovative work and to guard against fraud and misconduct, and the need for mechanisms for greater transparency and accountability in the use of public monies. Perhaps the biggest challenge is to infuse Chinese industrial enterprises with a zest for innovation and an understanding of how R&D and knowledge management more generally serve the longer-term interests of the enterprise. Similar challenges can be found in India.

At base, many of the challenges both countries face stem from the complexities of determining the proper role of government in promoting research and innovation. Both countries have experienced the positive effects of government action in human-resource development and in the initiation of new fields of research; indeed, without their active government policies, we would not be discussing their emergence as technological powers.

At the same time, the actions of the state have also led to resources being wasted on derivative research and distortions of market signals needed for strategically sound innovation decisions by industrial producers. Thus, the evolution of science/ state relations in the two countries warrants our continuing attention.

RICHARD P. SUTTMEIER

Professor of Political Science

University of Oregon

Eugene, Oregon


Major indicators point to the emergence of India and China as technological powers, but present conditions impose limits on the optimism about these two countries, most of which Carl J. Dahlman cites in his essay. There is one more. Central to the acquisition of globally competitive technological capabilities are strong supporting institutions and stable and efficient legal and governance systems, regardless of the nature of political systems. Continuous technological efforts demand the corresponding evolution of the country’s legal and governance apparatus in order to be more globally integrated and competitive. In this respect, both China and India face major challenges in improving government effectiveness and regulatory quality, upholding the rule of law, and controlling corruption.

An important point underpinning Dahlman’s discussion of the “critical details” in the technological transformation of India and China is that there are many ways to innovate, and there is no one right approach for all countries and technologies. Simply emulating the United States and Europe will not work, because both of these nations, along with other transition economies, face the dual challenge of overcoming enormous socioeconomic problems while trying to technologically catch up with more advanced economies to compete effectively in the global marketplace.

THE ROLE OF S&TIN INDIA SHOULD NOT BE CONFINED TO ELITE ORGANIZATIONS OR A SMALL SECTION OF POPULATION CAPABLE OF DOING SCIENTIFIC RESEARCH.

The rise of India and China as centers of global innovation will radically shake up the still primarily Western-based technology industry. It presents vast opportunities for both countries to introduce new policy and institutional approaches in how technology is created, developed, and performed; to dictate the global technological agenda; and ultimately to proffer a new way of defining technological leadership. In this respect, China’s ascendance begs the question of whether democracy will eventually have to be a necessary condition for global scientific and technological leadership. In other words, what will be the defining characteristics of a new world technology order?

Finally, Dahlman’s essay inspires the observation that linear forecasts of technological growth are subject to the vagaries of geopolitical realities. The complex political and economic relationship of China and India with the world’s current scientific and technological leader, the United States, will yield outcomes on the technological front that will not always be linked to socioeconomic growth but can make sense only if viewed from a strategic and security perspective.

VIRGINIA S. BACAY WATSON

Associate Professor

Asia-Pacific Center for Security Studies

Honolulu, Hawaii


Advice for India

Salil Tripathi’s “India’s Growth Path: Steady but not Straight” (Issues, Spring 2007) is a wide-ranging article focusing on the role of science and technology (S&T) in increasing incomes and improving the quality of life of India’s 1.1 billion people. Occasional clichés apart, the article does convey the sense that India’s economic growth path and evolving role of S&T will be steady, but not necessarily straight.

India has many of the right ingredients for high growth over the long term: institutions facilitating participation, a rising share of the young in the population, and greater acceptance of social entrepreneurship and markets. Challenges such as low quality of political leadership and government service delivery, poor physical infrastructure, environmental changes, and deficiencies in managing rapid growth and urbanization, however, strongly suggest that there is little room for complacency.

The role of S&T in India should not be confined to elite organizations or a small section of population capable of doing scientific research. A knowledge economy should involve applying different sub-branches of knowledge that are already available to obtain real resource cost savings and significantly enhance quality and productivity. For example, during a recent visit to a vegetable farm, a farmer indicated that his curved chilies fetched around 20% less than the straight ones. He wanted technical advice on applying existing knowledge to sharply reduce the proportion of curved chilies, helping to raise his income. This example can be multiplied many times in all areas, both in the public and private sectors.

It is therefore developing the mind-set and mechanisms for the diffusion of knowledge and innovations that is critical, particularly in India’s current catch-up phase.

There should have been a mention of the Knowledge Commission set up by the current government to help develop deeper and wider industry/science linkages, to promote S&T in institutions of higher learning and research, and to narrow the technology gap with the rest of the world. India’s relatively young population and its earlier inappropriate decision to separate scientific research from the universities lend urgency to increasing the supply of scientific and technical manpower, and to developing full-fledged universities.

But these initiatives have come into conflict with old dogmas that are no longer relevant and with entrenched interest groups. These include counterproductive use of quotas and reservations in higher-education institutions and government’s reluctance to modernize rules and regulations applied to the education sector with the aim of raising standards and increasing higher-education opportunities.

The application, adaptation, diffusion, and generation of scientific and technological knowledge in all areas of national life are essential for India. The challenges are huge, and there is room for all stakeholders. The government in particular should shift its mind-set from ruling and micromanagement to governing and enforcement of standards, while corporations should give greater weight to their social responsibility.

MUKUL G. ASHER

Professor of Public Policy

National University of Singapore

Singapore


China as innovator

“China’s Drive toward Innovation” by Alan Wm Wolff (Issues, Spring 2007) is an excellent and informative analysis of how China plans to wrest leadership in information technology from the United States. The challenge to U.S. leadership is very real, and the stakes are very high.

The emergence of China as a major force in the electronics industry is a healthy development. With the steady migration of electronics manufacturing over the past decade, China is now the world’s largest national market for semiconductors. Currently, China imports approximately 80% of the chips that go into electronic products manufactured in China. The Chinese government would like to reverse this ratio over time, and as Wolff notes, is currently formulating policies to achieve that end. Although we do not yet know precisely what policies will finally emerge, clearly there are some issues of concern on the horizon.

Intellectual property protection is one issue of major concern. China understands the need to improve its intellectual property protection regime in order to foster innovation and attract investment by foreign technology leaders. At the same time, however, China is considering adoption of an antimonopoly law that could undermine the intellectual property rights of companies deemed to have “a dominant market position.”

Another potential concern is the use of domestic standards to disadvantage foreign competitors and coerce them to transfer know-how and share proprietary technology with domestic producers in order to gain access to the enormous Chinese market. Several years ago the Chinese government proposed to promulgate its own wireless security standard (known as WAPI) for products such as portable computers and other devices with wireless connectivity. Only domestic producers would be allowed access to the encryption algorithm essential to comply with the WAPI standard. Fortunately, China put the proposed WAPI standard on hold in the face of strong international pressures and announcements by several important suppliers that they would withhold products from the Chinese market. Nevertheless, the idea of using proprietary standards to coerce technology transfer and weaken the intellectual property rights of foreign producers is still alive.

Although we have some concerns about these and other potential issues as China strives to foster innovation, we view these efforts on the whole as very positive. Competition is by far the most effective driver of progress and advances in semiconductor technology. We believe that market forces, not government-directed policies, foster effective competition. The Semiconductor Industry Association’s (SIA’s) top priorities, therefore, are aimed at enhancing the competitiveness and innovative capabilities of U.S. producers.

SIA’s public policy initiatives are based on three pillars of innovation:

  • Ensuring access to a world-class workforce by maintaining our leadership in university research and our ability to attract and retain the best and brightest from throughout the world.
  • Supporting basic research to advance the frontiers of science at U.S. universities and national laboratories.
  • Ensuring that we have a competitive investment climate for capital-intensive industries and R&D programs in the United States.

Wolff’s article is an excellent summary of the challenge we face from China. It is up to us to meet this challenge.

GEORGE M. SCALISE

President

Semiconductor Industry Association

San Jose, California


Alan Wm Wolff does all of us a great service by concisely describing many of the most important issues and trends in China’s current innovation drive. I would differ in emphasis in only two areas.

I would not describe the Medium- and Long-Term Program on Science and Technology Development as “remarkably different” from what emerged before. Almost all of the specific policy goals and tools discussed in the program have their origins in earlier plans or experiments. All of the previous major policies—the 863 and 973 Plans—targeted “critical” or “strategic” technologies on a large scale. The Torch Plan, initiated in May 1988, supported science parks and high-technology development zones and provided loans, subsidies, and other benefits for small startup enterprises. Almost all technology policy has involved the coordinated action of state actors at the local, provincial, and national level.

The Medium- to Long-Term Program may be most notable not because of its ambition or scope, but because of how it was put together. Over 2,000 experts took part in early discussions of the program’s goals and of how policies should be developed and implemented. Some analysts involved have complained that representatives of the business community were not included in these preliminary discussions, but the process was remarkably open and consultative for the Chinese context.

FOR THE UNITED STATES TO MAINTAIN THE COMPETITIVE ADVANTAGE THAT WOULD ENSURE ITS STANDARD OF LIVING AND ITS ABILITY TO PROFIT FROM THE WORLDWIDE EXPANSION OF TECHNOLOGICAL CAPABILITIES, WE NEED A MAJOR REVOLUTION IN EDUCATION.

Also, the Medium- and Long-Term Program reveals an underlying political tension over technology development in China. As Wolff notes, the stress on “independence” or “selfreliance” reveals a continued technonationalist strain in the Chinese bureaucracy, yet a great number of the specific policies in the program revolve around creating a more robust ecosystem for technological innovation. These policies are less interventionist, more open to the outside world, and more focused, in the words of the Chinese economist Wu Jinglian, on creating “the right environment where qualified personnel of all types, including technical personnel and managerial personnel, can put their talents to good use.”

Wolff skillfully describes the resources flowing into and the political will dedicated to building an indigenous innovative capacity. He is equally convincing in delineating the social, political, and economic barriers to innovation with China. Yet it strikes me that the most pressing question is not whether China “will evolve into a major source of innovation in the not-too-distant future,” but rather how a unique innovative system is already emerging from the mix of China’s strengths and weaknesses. The most likely outcome, at least in the mid-term, is not system-wide innovation, but innovation located within a specific industry or geographic location.

Take the chip industry as an example. Government policies skewer incentives, promote reverse engineering, and create massive time pressure to produce outcomes, fostering the conditions of the Han Xin chip scandal—a government-supported scientist passing off a Moto-Freescale chip as an “indigenous innovation.” At the same time, China’s chip design sector has developed faster than we might expect, because scientists and entrepreneurs have returned from Silicon Valley to set up their own companies, and multinationals are increasingly locating production and research and design in Beijing and Shanghai. China in the future will be innovative, but in, at least initially, a limited number of industrial sectors.

ADAM SEGAL

Senior Fellow in China Studies

Council on Foreign Relations

New York, New York

Adam Segal is the author of Digital Dragon: High Technology Enterprises in China (Cornell University Press, 2002).


Education and U.S. competitiveness

Congressman Bart Gordon’s “U.S. Competitiveness: The Education Imperative” (Issues, Spring 2007) is an illuminating summary of what needs to be done to halt the nation’s slide in science and technology (S&T) relative to our competitors. The revolutionary advances of globalization and technology are enabling nations around the globe to produce scientists, engineers, and technicians who are as well or better educated than ours and who can afford to work for a fraction of the cost of a U.S. engineer.

Gordon understands the crucial role of U.S. education and the data indicating that we have a failing educational system. Since he is in a position to implement educational reform, the article provides important insights into a problem of great complexity. Gordon seizes on the need to improve the education of new K-12 science and math teachers. The concurrent need for students to accept and thrive in the K-12 system raises new issues for the nation to address. Gordon notes that there is not enough data to support conclusions about the supply and demand of science, technology, engineering, and mathematics (STEM) professionals. We do know that increasing use is being made of offshoring S&T tasks.

It is here that this reader departs more in scale than in content from Gordon. U.S. post–World War II prosperity emerged from a huge investment (the G.I. Bill) in our human resources and a strong and continuing contribution from immigration. For decades, some 60% of our graduate schools were occupied by immigrants. About half of these students returned home and half stayed to contribute to a vibrant S&T workforce. However, as anticipated by Alan Greenspan, over time and for a variety of reasons, our educational system began to fail and our immigration began to decline. Today, we are witnessing the results of this double whammy. Our primary-school teachers are emerging from teachers’ colleges as ignorant as ever of math and science. U.S. students begin to turn off in early grades. Our middle- and high-school curricula are out of the 19th century, and the “system” of 50 states, 15,000 school boards, 25,000 high schools, teachers’ unions, PTAs, and textbook publishers, and the wide diversity of public school education, all provide an awesome challenge. We need not to fine-tune around the edges but to transform this impossible system.

China and India are the tip of the iceberg. For the United States to maintain the competitive advantage that would ensure its standard of living and its ability to profit from the worldwide expansion of technological capabilities, we need a major revolution in education. As Gordon suggests, U.S. trained STEM workers will require skills that will differentiate them from their foreign competitors. This will require a pre-K–through–grade 16 revolution in the quality of teachers; in the construction of 21st-century curricula; and in the popular recognition of the need for excellence, creativity, and high-quality education across all disciplines. Our requirements are greatly enhanced by the desperate need to address the S&T of energy in the world’s ecological crises.

I am sure that Gordon knows the magnitude of the problem but also the political realities. These may be dictating steps that are far too modest for the tasks ahead.

LEON M. LEDERMAN

Pritzker Professor of Science

Illinois Institute of Technology

Nobel Laureate in Physics 1988


Representative Bart Gordon’s article offers a concise overview of the competitiveness problem that America faces and the implications of this problem for education. Reducing the number of “out-of-field” teachers, offering more and better professional development, providing incentives to encourage students to pursue careers as math and science teachers, and fostering more collaboration among math, science and education faculties are all sensible (though long-term) ways to strengthen math and science teaching and learning in schools.

Since the article’s publication, Gordon’s proposed legislation to increase the teacher pipeline has passed in the House; the America Competes Act, a similar bill, also passed in the Senate. We can be hopeful that many of the recommendations in the National Academies’ report Rising Above the Gathering Storm, will soon receive funding.

That said, addressing the teaching side of the equation is only one part of the needed solution. We must also attend to the needs of today’s K-12 students and not neglect those who demonstrate potential talent in the science, technology, engineering, and mathematics (STEM) fields. We need both a well-prepared workforce and the future innovators whose ideas could transform the economy. This does not just happen by chance. There is also a large pool of untapped talent for STEM careers. It is made up of students who score well on spatial ability measures but who are mostly overlooked in school environments emphasizing math and verbal abilities. Students who learn with their hands, or through visualization, are too often turned off by the heavily verbal orientation in schools. Identifying and nurturing spatial talent could open access to an underused and under-appreciated group ideally suited for STEM careers and thus greatly improve our national ability to compete.

CAMILLA P. BENBOW

Patricia and Rodes Hart Dean of Education and Human Development

Peabody College, Vanderbilt University

Nashville, Tennessee


Representative Bart Gordon has been a champion of science and math in Congress, and we agree completely that the necessary first step in any competitiveness agenda is to improve science and math education. For over two years now, scores of leading policymakers and business leaders have been calling for reforms in science, technology, engineering, and mathematics education and offering a myriad of suggestions on how to “fix the problem.”

Before we can fix the problem, however, we have to do a much better job of explaining what is actually broken. A survey last year of over 1,300 parents by the research firm Public Agenda found that most parents are actually quite content with the science and math instruction their child receives; 57% of the parents surveyed said that the amount of math and science taught in their child’s public school was “fine.” At the high-school level, 70% of parents were satisfied with the amount of science and math education.

Why is there such a disconnect between key leaders and parents? Clearly we have to get parents on board that there is, in fact, a crisis in science and math education and it’s in their neighborhood too.

With all the stakeholders on board we can work together to ensure innovations and programs are at the proper scale to have a significant impact on students. We can ensure that teachers gain a deeper understanding of the science content they are asked to teach, and we can do a much better job of preparing our future teachers. Together we need to overhaul elementary science education and provide all teachers with the support and resources they need to effectively teach science. Our nation’s future depends on it.

GERALD WHEELER

Executive Director

National Science Teachers Association

Arlington, Virginia


Emissions reduction

I am commenting on “Promoting Low-Carbon Electricity Production” by Jay Apt, David W. Keith, and M. Granger Morgan in your Spring issue. As the scientific evidence continues to mount about global climate change, the general public and the business communities seek clear governmental direction to address the implications of increased carbon dioxide (CO2) and other greenhouse gas emissions. Throughout the United States, progressive governmental officials have taken up the environmental mantle that has been dropped by the federal government during the Bush administration. Various governors and mayors have pledged and developed plans to cut back CO2 emissions.

In New Jersey, Governor Corzine issued an executive order to reduce greenhouse gas emissions to 1990 levels by 2020, a 20% reduction, followed by a further reduction of emissions to 80% below 2006 levels by 2050. As a founding member of the Regional Greenhouse Gas Initiative (RGGI), a cooperative effort of northeastern and mid-Atlantic states, New Jersey will set up a cap-and-trade program to limit CO2 emissions from regional electric power plants. RGGI will be the first regulatory effort in the United States addressing CO2 emissions.

Both RGGI and the European Union’s CO2 program naturally follow principles from the highly successful U.S. nitrous oxide (NOx) and sulfur dioxide (SOx) trading programs. These NOx and SOx programs implemented market-based solutions to manage air pollution, which previously had been a classic market externality managed only through environmental regulation. Because the NOx and SOx cap-and-trade programs created a proven approach to reducing pollution, the subsequent efforts to curtail CO2 emissions in Europe and the United States followed this methodology.

Although cap and trade is the current expedient policy for reducing CO2 emissions, the carbon emission portfolio standard (CPS), as outlined in the article, could ultimately be the more cogent effort. The CPS directly targets CO2, making it more effective, fairer, and ultimately easier to administer. The CPS would require each supplier to meet an overall constraint on its CO2 emissions but enable trading among other market participants. The CPS would reduce CO2 emissions by creating appropriate market signals and eliminating the externalities associated with CO2 emissions.

Good government needs to establish a solid framework to let the invisible hand of the free market work its magic. We must use our imagination to create new approaches. Carrots work better than regulatory sticks, and following that philosophy will expedite our reduction of CO2 emissions. We need action now to dramatically reduce the buildup of CO2, whose presence lingers in the atmosphere for decades and has devastating effects on the world’s climate.

JEANNE M. FOX

President

New Jersey Board of Public Utilities

Newark, New Jersey


Assessing science’s social effects

I appreciate the opportunity to comment on Robert Frodeman and J. Britt Holbrook’s article (“Science’s Social Effects,” Issues, Spring 2007). They present some thoughtful observations and provocative suggestions.

The National Science Foundation (NSF), by action of the National Science Board, added the “broader impacts criterion” around 1997 in order to clarify ambiguous language in the criteria existing before that time, respond to congressional inquiries and laws (such as the Government Performance and Results Act), and garner greater public support for research by acknowledging, explicitly, that the rationale for federal research funding is the expectation of public benefits down the road, especially training the next generation of scientists and engineers. It was understood, at the outset, that there is no single template and that different projects will address this criterion in different ways, the investigators themselves being the best persons to make that determination. It was considered likely, indeed a good outcome, that investigators would consult with others on how to address this criterion.

Most researchers and NSF program officers believed at the time and, I suspect, believe today that the principal criterion by which proposals should be evaluated is the first, intellectual merit, and that proposals that fail to meet that criterion should not be funded. Certainly, that is my view. But it should also be said that aspects of broader impact are often an integral part of the intellectual merit of the proposal. So in many cases, the separation is artificial. The review process should be sufficiently flexible to handle that ambiguity.

I agree with Frodeman and Holbrook that the second criterion should not be treated simply as a tiebreaker and that it ought to extend beyond education and outreach. However, in many cases, I believe that the wider “moral, political and policy” implications of the proposed research are simply not knowable in advance. Where an investigator feels he or she can speculate with some confidence (such as regarding a possible new energy technology), such information should be considered. I agree with the authors that scientists need to understand more about the public, but I am uncomfortable with the phrase “impure science” as a way of emphasizing that research supported by taxpayer money should reflect taxpayers’ interests. I also identify with the authors’ plea to science and engineering researchers and humanities and social sciences scholars, especially those who do research on science, to reach across the campus and examine the intellectual opportunities that the broader impacts criterion offers. But although it might be useful for review panels to include this broader constituency, I am not convinced that the same argument holds for individual reviews. I believe that the wider moral, political, and policy implications of research supported by NSF are more appropriately examined at the aggregated level of the agency, directorate, or perhaps division or program, rather than for individual proposals. Additional requirements at the proposal level risk squeezing out precisely the kinds of basic studies that lead to major discoveries.

NEAL LANE

Malcolm Gillis University Professor and Senior Fellow

James A. Baker III Institute for Public Policy

Rice University

Houston, Texas


As Roger Penrose said in his book The Road To Reality (p. 1028), science does not address the why of nature, science only describes nature (my abridging paraphrase). The failure to recognize and articulate this fundamental endeavor of science, not only within the general public but within the scientific, fundamentalist religious, political, and philosophic communities, contributes significantly to the angst in such debates as those over intelligent design versus evolution and embryonic stem cell research. Thus it is that my reaction to the National Science Foundation’s requirement that grant proposals address the connection between their research and its broader effects on society is “Huh?”

Robert Frodeman and J. Britt Holbrook term this requirement the “broader impacts criterion” and further elaborate that its intent is to reflect on science’s impacts on the moral, political, ethical, and cultural elements of society. To what end, they do not say. Is it the contention that by understanding these impacts (assuming for the sake of discussion that this is in any way predictable) we should, or could, judge what knowledge of the workings of nature would be either socially constructive or destructive?

The authors state that the quality of the responses to the requirement remains a persistent problem. Could it be, perhaps, that the evaluators of the proposals have failed to describe the criteria by which the responses are evaluated? Certainly the authors have omitted such descriptions, other than the vague, and one might say almost meaningless, terms given above; and if I were one submitting a response I would certainly like some such guidance. It is my understanding that the grant proposals should be evaluated on the basis of priorities as well as intellectual merit. There is no doubt considerable debate about priorities but consideration of our current and projected problems would be legitimate concerns as well as assessments of the potential for the research to address these problems. I guess the question would here be the extent to which moral, ethical, political, and cultural issues serve to define these problems? Obviously, scientists have input to contribute to such discussions, but is some ill-defined appreciation of these aspects really germane to the merit of the research proposed?

I am just an old retired systems engineer and, as such, perhaps not deemed qualified to have an informed opinion on such matters. Still, when I read pieces like this I have to wonder if the authors are not too dismissive of the elementary fundamentals of problem-solving. The authors have not stated the purpose and objective of the broader impacts criterion. They have not defined the problem and listed their assumptions nor have they given any analysis or rationale for how applying this criterion would serve to contribute to a solution. On second thought, perhaps asking the scientists to show them the way is not such a bad idea after all. The one thing a technical education does (hopefully) is teach one how to think.

CLAY W. CRITES

West Chester, Pennsylvania

Does Science Policy Matter?

It is not only axiomatic but also true that federal science policy is largely played out as federal science budget policy. Science advocacy organizations such as the American Association for the Advancement of Science (AAAS), the National Academies, and various disciplinary professional societies carefully monitor the budget process and publish periodic assessments, while issue-focused interest groups such as disease lobbies and environmental organizations focus on agencies and programs of specific relevance to their constituencies. Overall, it is fair to say that marginal budgetary changes are treated by the science and technology (S&T) community as surrogates for the well-being of the science enterprise, while the interested public considers such changes to be surrogates for progress toward particular societal goals (for example, budget increases for cancer research mean more rapid progress toward cures). In this dominant science policy worldview, yearly budget increases mean that science is doing well, and doing good. When budgets are flat or declining—or even when rates of budget increases are slowing—then science must suffer and so, by extension, must the prospects for humanity.

In recent years, this worldview was perhaps most starkly on display in discussions about the National Institutes of Health (NIH), whose budget doubled between 1998 and 2003 as a result of a highly effective lobbying effort, a sympathetic Congress, and a brief period of overall budgetary surplus. During this period, the NIH budget went from $13.6 billion to $27.0 billion, and the NIH share of all civilian federally funded research rose from its already dominant 37% to 48%. Nevertheless, when the fiscal year (FY) 2004 budget debates began, NIH and its advocates in the research community portrayed the situation as one of crisis arising from a sudden decline in the rate of budget increase. Said a representative of the Association of American Medical Colleges: “Two or three years of 2 or 3% increases, and you’ve pretty much lost what you’ve gained . . . And you’ve certainly lost the morale of investigators who can’t help but be demoralized by trying to compete for funding under those circumstances.” In another notable example, the president-elect of the AAAS in 1990 solicited letters from 250 scientists and discovered that many were unhappy because they felt that they did not have enough funding. From this information he inferred an “impoverishment” of basic research even though, as he acknowledged, science funding had been growing steadily.

In this article I will argue that the annual obsession with marginal changes in the R&D budget tells us something important about the internal politics of science, but little, if anything, that’s useful about the health of the science enterprise as a whole. In particular, marginal budget changes give almost no information about the capacity of the science enterprise to contribute to the wide array of social goals that justifies society’s investment in science. I will return to this point later; first I will focus on the more parochial reality that the annual federal budget numbers for science cannot be understood unless they are placed in a broader political and historical context. A given year’s marginal budget increase says as much about the health of the science enterprise as the nutritional value of a single meal says about the health of one’s body.

One of the most astonishing aspects of science policy over the past 30 or so years is the consistency of R&D funding levels as a proportion of the discretionary budget (Figure 1). (Discretionary spending is the part of the budget that is subject to annual congressional decisions about spending levels.) Since the mid-1970s, nondefense R&D budgets have constituted between 10 and 12% of total nondefense discretionary spending. Total R&D (defense and non-defense) shows a similar stability at 13 to 14% of the total discretionary budget. This consistency tells us that marginal changes in the R&D budget are tightly coupled to trends in discretionary spending as a whole.

Given the Balkanized manner in which science budgets are determined, such stability at first blush may seem incomprehensible. After all, no capacity exists in the U.S. government to undertake centralized, strategic science policy planning across the gamut of federal R&D agencies and activities. The seat of U.S. science policy in the executive branch is the Office of Science and Technology Policy, whose director is the president’s science advisor. The influence of this position has waxed and waned (mostly waned) with time, but it has never been sufficient to exercise significant control over budgetary planning. That control sits with the Office of Management and Budget, which solicits budgetary needs from the many executive agencies that conduct R&D, negotiates with and among the agencies to reach a final number that is consistent with the president’s budgetary goals, and then combines the individual agency budgets for reporting purposes into categories that create the illusion of a coherent R&D budget. But this budget is an artificial construct that conceals the internal history, politics, and culture of each individual agency.

The situation in Congress is even more Byzantine, with 20 or more authorization and appropriations committees (and innumerably more subcommittees) in the Senate and House each exercising jurisdiction over various pieces of the publicly funded R&D enterprise. Moreover, the jurisdiction of the authorizing committees does not match that of the appropriations committees; nor do the allocations of jurisdiction among Senate committees match those of the House. Finally, the appropriations process puts S&T agencies such as the National Science Foundation (NSF) and the National Aeronautics and Space Administration (NASA) in direct competition with other agencies such as the Department of Justice and the Office of the U.S. Trade Representative for particular slices of the budgetary pie.

In total, the decentralization of influence over S&T budgeting in the federal government precludes any strategic approach to priority setting and funding allocations. Although an “R&D” budget can be—and is—constructed and analyzed each year, this budget is an after-the-fact summation of numerous independent actions taken by congressional committees and executive-branch bodies, each of which is in turn influenced by its own set of constituents and shifting priorities. From this perspective, if science policy is mostly science budget policy, then one can reasonably assert that there is no such thing as a national science policy in the United States.

If central science policy planning in the United States is impossible, how is one to make sense of the remarkable stability of R&D spending as a proportion of the total discretionary budget? Several related factors come into play. First, the political dynamics of budget-making result in a highly buffered system where every major program is protected by an array of advocates and entrenched interests fighting for more resources and thus, on the whole, offsetting the efforts of other advocates and interests trying to advance other programs. Second, annual marginal changes in any program or agency budget are generally small: This year’s budget is almost always the strongest predictor of next year’s budget. Large changes mean that a particular priority has gained precedence over other, competing ones, and such situations are not only uncommon but usually related to a galvanizing political crisis, such as 9/11, or the launching of Sputnik. Third, in light of the previous considerations, annual changes in expenditure levels, whether for R&D programs or judges’ salaries, are on average going to be in line with overall trends in the federal discretionary budget as a whole. Thus, long-term stability in R&D spending as a percentage of the whole budget is what we should expect to see exactly because of the decentralized essence of science policy.

Of course this reality means that federal support for S&T is subject to the same political processes and indignities as other federal discretionary programs. Although such a notion may offend the common claims of privilege made on behalf of publicly funded science, it also offers evidence of a durable embeddedness of S&T in the political process as a whole, an embeddedness that has offered and will probably continue to offer significant protection against major disturbances in overall funding commitments for R&D activities. For this reason, predictions of impending catastrophe for research budgets (for example, in the mid-1990s, many science policy leaders believed that cuts of up to 20% in R&D were all but inevitable) have not come true. On the other hand, in periods of particular stress on the discretionary budget (and we are now in such a period) R&D faces the same budgetary pressures as other crucial areas of government budgetary responsibility, from managing national parks and supporting diplomatic missions to providing nutritional programs for poor infants and mothers or monitoring the safety of the nation’s food supply.

Thus, any time of famine (or feast) for public civilian R&D funding as a whole will be a time of famine (or feast) for most other nonmilitary government programs subject to the annual budgeting process. Any argument that R&D deserves special protection from budgetary pressures is implicitly an argument that other programs are less deserving of protection. One sure way for R&D advocates to threaten the considerable stability of research funding in the budget would be to begin to target other, non-R&D programs as somehow less deserving of support. However compelling such arguments might seem to those who recognize the importance of a robust national investment in R&D, they will also be a provocation to those who are similarly compelled by competing priorities.

Stability means growth

It will not have escaped the alert reader’s notice that the 1960s do not fit into the story I have been telling so far. As Figure 1 shows, civilian R&D funding relative to discretionary spending increased markedly in the early 1960s, peaked in 1965, and then declined to the levels that were to characterize the next 30 years. This excursion can be explained in one word: Apollo.

In the wake of Sputnik and at the height of the Cold War, President Kennedy’s decision to send people to the Moon represents by far the most notable exception to the highly stable, buffered system that characterizes recent public funding for R&D: NASA’s budget increased about 15-fold between 1960 and 1966. At the apogee of Apollo spending in 1966, nondefense R&D accounted for 25% of nondefense discretionary expenditures, but if you subtract the NASA component, the R&D investment falls to only about 6%. The perturbation was driven by external geopolitical forces; this was not the internal logic of scientific opportunity making itself felt.

Source: AAAS, based on Budget of the U.S. Government FY 2007 Historical Tables

Apollo aside, the stability of the government’s commitment to R&D as a proportion of its entire portfolio of discretionary activities also represents a commitment to growth. In 1960, before the Apollo ramp-up, nondefense R&D made up about 10% of nondefense discretionary spending, a level to which it returned after Apollo. Meanwhile, from 1962 (the first year for which reliable comparable date are available) to 2006, total nondefense inflation-adjusted R&D expenditures (in FY 2000 constant dollars) rose 335%, a rate of increase that closely mirrors general budgetary growth as a whole, rather than some natural rate of expansion of the knowledge-producing enterprise.

Of course these macroscale trends conceal internal variations. NASA’s rapid budgetary ascension was followed by a more gradual decay curve, but even at its 1974 post-Apollo perigee, NASA’s budget of $3.2 billion (in current dollars) exceeded that of any other civilian R&D agency. NIH did not catch up to NASA until 1983, and did not leave it in the dust until the doubling began in 1998 (today, NIH’s budget is almost 2.5 times NASA’s). In 1977, in the wake of the Arab oil embargos, President Carter consolidated several agencies and programs to create the Department of Energy (DOE), with budgets of NASA-like magnitude. DOE’s fortunes declined by almost 30% in terms of spending power under President Reagan, and today, after accounting for inflation, its budget is less than it was at its inception. NSF, whose importance for supporting university research belies its relatively modest share of overall nondefense R&D, has experienced budget increases in all but 2 of the past 42 years. By remaining more or less aloof from focused political attention, NSF has avoided the volatility of DOE and NASA and, like the old blue-chip stocks, has yielded persistent if unspectacular growth. Its 2006 level of $5.5 billion ($4.2 billion for research) is still considerably less than that of NASA ($11.3 billion), DOE ($8.6 billion), or NIH ($28.4 billion). Overall, while civilian R&D as a whole is under the grip of a sort of budgetary lock-in due to larger political forces, the internal texture of the R&D budget is continually rewoven by dynamic political processes.

The stability of the federal commitment to S&T is matched, indeed exceeded, by a particular commitment to basic research. One of the most persistent myths of science policy is that government support for basic research is soft and has eroded over time. Indeed, the vulnerability of basic research to the vulgarities of politics has been an article of faith among science advocates at least since World War II, when Vannevar Bush, chief architect of NSF, explained in the classic report Science, the Endless Frontier that both government and industry were naturally inclined to favor investments in applied research over basic. Yet federal basic research investments (nondefense and defense) over the past 40 or so years have risen more quickly than R&D budgets as a whole. In 1962, the government investment in basic research was about 60% that of applied research; basic and applied reached parity in the late 1970s; and in recent years, driven especially by the NIH doubling, basic has exceeded applied by as much as 40%.

Despite the warnings of Vannevar Bush and subsequent science advocates, the political case for basic research is both strong and ideologically ecumenical. Unlike applied R&D, basic research appeals to the political left as an exemplar of the free expression of the human intellect, to the political right as an unambiguously appropriate area of government intervention because of the failure of the market to provide adequate incentives for private-sector investment, and to centrists as an important component of the government’s role in stimulating high-technology innovation. In 1994, when Democrats lost their grip on Congress to a Republican majority bent on budget cutting, I recall that many of my scientist friends went into a panic, certain that academic basic research would be on the chopping block. But the value of federal investments in basic research was one thing that President Bill Clinton and House Speaker Newt Gingrich could agree on, and basic science fared well—better than it had under the Democrats in the first two years of the Clinton regime. Moreover, the general public, so often characterized as scientifically illiterate by politically illiterate scientists, has for decades shown very strong support for basic research in public opinion surveys.

Of course research that is “basic” is not necessarily irrelevant. Not only may scientists be curious about problems of abiding practical interest, but scientists may pursue questions that to them are of purely intellectual interest but to research administrators and policymakers are part of a more strategic effort to advance a particular mission. Economists such as Nathan Rosenberg and Richard Nelson and historians such as Stuart Leslie have demonstrated that basic research agendas have throughout the post–World War II era been strongly tied to the priorities of the private sector and national defense. Even arcane fields such as subatomic particle physics were justified during the Cold War in part because they were the training grounds for the nation’s next generation of weapons scientists. The great majority of federal research categorized as basic is funded as part of larger agency missions, NIH being the most obvious example today, and the Department of Defense in earlier decades. NSF is the most conspicuous exception, although this, too, has been changing as NSF priorities increasingly focus on real-world priorities ranging from climate change to nanotechnology. Although such realities take the gloss off notions of scientific purity, they help to explain why, year after year, 535 members of Congress, most of whom have little if any deep knowledge of science, continue to treat basic science with a level of consideration equal to that of new post offices, interstate cloverleafs, and agricultural price subsidies.

IF THE POSITIVE AND NEGATIVE EFFECTS OF SCIENCE ARE UNEVENLY DISTRIBUTED, THE PRIMACY OF “HOW MUCH” BECOMES MORE DIFFICULT TO JUSTIFY. AND OF COURSE THE POSITIVE AND NEGATIVE EFFECTS OF SCIENCE ARE INDEED UNEVENLY DISTRIBUTED.

The budgetary picture for R&D is not just about public investments, of course. When public and private support for R&D are considered together, evidence of consistent growth is even more pronounced, with inflation-adjusted expenditures rising from $71 billion in 1962 to $270 billion in 2004 (in FY 2000 dollars). Most of this growth has come in the private sector; indeed, this period shows a progressive decline in the ratio of federal to private funding for R&D. In 1962, the government funded twice as much R&D as did private industry. The continued growth of the high-technology economy led to increasing private-sector investment in R&D, and by 1980 the share of R&D funded by industry slightly exceeded the public share. By 2004, industrial R&D funding was more than twice that of government. From a simple market failure perspective, this trend represents a tremendous success: The private sector is taking on an increasing share of the knowledge-creation burden of society as the government investment brings increasing long-term economic returns.

There are, however, many good reasons for investing in science beyond just compensating for market failure. I want to emphasize that the continual attention paid to the amount of investment in R&D, whether public or private, military or civilian, tends to come at the expense of attention to these other reasons. One can easily imagine a variety of very different R&D portfolios for given levels of investment. Presumably each of those portfolios would contribute to very different sets of social outcomes. One could even imagine a large R&D investment portfolio organized in a way that contributes less to public well-being than a different, smaller portfolio.

A real-world experiment

The real world provides a way to begin thinking about such issues. R&D policies, and the resulting structures of national R&D enterprises, do vary significantly from nation to nation. For example, among nations that invest substantially in R&D, industrial funding ranges from 75% of total R&D in Japan, to 63% in France, to 51% in Canada. Within the public investment sphere there are enormous differences in priorities among nations. The most obvious indicator of this diversity is biomedical science, which in the United States commands almost 50% of the total federal nondefense R&D budget, compared to 4% in Japan and Germany, 6% in France, and 20% in the United Kingdom. Similarly, Japan devotes about 20% of its civilian R&D to energy, whereas the United States spends about 3%, Germany 4%, France around 7%, and the United Kingdom 1%. The United States spends about 20% of its civilian R&D on space, France 10%, Germany 5%, and so on.

WHAT IS THE CAPACITY OF A PARTICULAR SCIENCE POLICY DECISION TO ADVANCE A GIVEN DESIRABLE OUTCOME? THIS SHOULD BE THE MOST FUNDAMENTAL SCIENCE POLICY QUESTION.

Such numbers don’t tell the whole story, because European nations and Japan distribute large chunks of their federal R&D dollars in the form of block grants to universities, which then have discretion in allocating among various fields. Both within and between nations there is an enormous diversity of policy models used to determine R&D priorities, to translate those priorities into actual expenditures, and to apply those expenditures to science. In some ways the United States, with its Balkanized budgetary authority, is more decentralized and more diverse than most other affluent nations. At the same time, in the United States there is a tighter linkage between specific agency missions and funding allocation to research performers than in many other R&D-intensive nations. And of course the decision processes for the disbursement of funds in universities and national laboratories (as well as the relative roles of different types of R&D-performing institutions) vary greatly from nation to nation and within nations. The role of peer review, smart managers, earmarks, block grants, and equity policies (for example, NSF’s Experimental Program to Stimulate Competitive Research and German efforts to support institutions in the east) are all highly variable and reflect different institutional and national histories, politics, and cultures. Human resources are also variable, with the proportion of scientists and engineers at over 9 per 1,000 in Japan, 8 in the United States, 6 in France and Germany, and 5 in the United Kingdom. And of course the role of public R&D in “industrial policies” has varied greatly over time within the United States alone and varies greatly between nations and between sectors. The 1991 Office of Technology Assessment report Federally Funded Research: Decisions for a Decade summed up the situation: “While there may be certain universality in science, this does not carry over to science policy.”

Of course it is these very details that make up the nuts and bolts of what science and technology policy is supposed to be all about, and much emotion and energy are invested in promoting policies that favor one approach, priority, or program over another. But given the great diversity in science policies both within and among affluent nations, and given the relative similarity of the macroeconomic and socioeconomic profiles of these same nations, I can see no reason to believe that there is a strong linkage between specific national science policies and general national-scale socioeconomic characteristics. Of course, the United States has a strong aerospace industry and a strong pharmaceutical industry in part because of R&D policy priorities during the past 50 years, but it still has a 20% pretax poverty rate, average life expectancy in the mid-70s, gross domestic product per capita above $30,000, a Human Development Index above 0.9, and so on, just like other affluent nations with very different approaches to investing in R&D. (The United States also has famously mediocre public health indicators despite its gargantuan investment in biomedical research.) So, although federally sponsored S&T are obviously causal contributors to public welfare and although S&T policies of some sort are necessary to ensure such contributions in the future, there is little reason to imagine that, at the macro policy level, particular policy models and choices make much of a difference to broad socioeconomic outcomes. There seems to be a diverse range of options that work more or less equally well, and this diversity may itself be a component of success.

From this perspective, the machinations of science policy—the constant stream of conferences, reports, and opeds; the dozens of committees and working groups; the lobbying and legislation; the hyperbole and anxiety—are best viewed as metabolic byproducts of a struggle for influence and funding among various political actors such as members of Congress, executive-branch administrators, corporate lobbyists, college presidents, and practicing scientists. The significance of this struggle is largely political and internal to the R&D enterprise; it is not a debate over the future of the nation, despite continual grandiose claims to the contrary. We are mostly engaged in science politics, not science policy. Or, to adopt the perspective of Thomas Kuhn, this is normal science policy, science policy that reinforces the status quo.

Publicly funded research is justified on the basis of promised contributions to desired social outcomes: to “increase quality and years of healthy life [and] eliminate health disparities” (U.S. Department of Health and Human Services), to “conserve and manage wisely the Nation’s coastal and marine resources” (National Oceanic and Atmospheric Administration), or to ensure “a safe and affordable food supply” (U.S. Department of Agriculture). What is the capacity of a particular science policy decision to advance a given desirable outcome? This should be the most fundamental science policy question, because if one cannot answer it, then one cannot know whether any particular policy is likely to be more or less effective than any alternative policy. And if one cannot choose among alternative policies in terms of what they may achieve, then policy preferences are revealed as nothing more than expressions of parochial values and interests. This, as I’ve discussed, turns out to be a perfectly good approach to ensuring that R&D investments are treated as well as other public investments. But it does not tell us whether different investment choices would yield better (or worse) outcomes.

At the highly aggregated level of “national” R&D policies, it appears that different approaches yield more or less similar outcomes. But when trying to connect R&D to particular desired outcomes, policy choices obviously can matter greatly. The doubling of the NIH budget is a case in point. This doubling occurred without any national dialogue about what it might achieve or about alternative paths toward better national and global health. In part because of the close coupling between NIH research agendas and biomedical industry priorities, high-technology intervention (often at high cost, as well) has been adopted as the national strategy for improved health, and no serious consideration was given to alternative health investment strategies that might be equally effective in contributing to public well-being but less likely to contribute to significant corporate profitability. Even further from the debate was the question of whether biomedical research was the area of science that could yield the most public value from a rapid increase in investment, rather than, say, energy R&D. One might compellingly have made the case that the nation’s health challenges are far less of an immediate threat to well-being than its dependence on fossil fuels imported in large part from other nations. That there are no mechanisms or forums to explore these types of tensions between alternative approaches to a particular goal, such as better health, or between competing goals, such as better health or better energy, is precisely the problem.

The internal political dynamics of science budgeting help to explain why R&D policy discussions are dominated by concerns about “how much” and avoid like the plague serious questions about “what for.” But I’m suggesting here that the “how much” obsession may paradoxically reduce the potential contribution of R&D to well-being, because “more” and “better” are simply not the same things. For example, “how much” carries with it a key, but unstated, assumption: that everyone is made better off by investments in science. If the benefits of science are broadly and equitably distributed, then “how much science can we afford?” is a reasonable central question for science policy, especially given the decentralization of the policy process. Whatever the priorities may be, we can expect that all will benefit. But if the positive and negative effects of science are unevenly distributed, the primacy of “how much” becomes more difficult to justify from a perspective of good governance and good government. And of course the positive and negative effects of science are indeed unevenly distributed. In fact, given what we know about such problems as unequal access to health care and the disproportionate exposure of poor people to environmental hazards, my colleague Edward Woodhouse and I have recently suggested a hypothesis that seems to us both reasonable and worthy of careful testing: New scientific and technological capacities introduced into a highly stratified society will tend disproportionately to benefit the affluent and powerful.

It is not very difficult to imagine the types of questions that might help to inform a transition from science policy based on “how much” to science policy based on “what for,” though it is certainly the case that such questions may be rather unwelcome in national R&D policy discussions and that even partial answers will not always be available, at least at first. But here are 10 questions that, if made explicit in science policy discussions, could help with the transition.

Addressing these questions does not require impossible predictions of either the direction of scientific advance or the complex interactions between science and society. It does require that unstated agendas and assumptions, diverse perspectives, and the lessons of past experiences be part of the discussion. The questions are as appropriate for academic scholarship as they are for congressional hearings or media inquiries. Taking them seriously would be a step toward a science policy that mattered.

Community College: The Unfinished Revolution

In the current debate about U.S. economic competitiveness and the need to provide better education for everyone, there is a new consensus that nearly all young people should attend college. Indeed, society’s ambitious college-for-all goal has had impressive success. More than 80% of high-school graduates enter higher education in the eight years after high school. Even more impressive, the racial gap in college enrollment has largely disappeared. Despite the continuing racial gap in high-school graduation, 83.5% of white high-school graduates attend college in the eight years after high school; the rates are only 3% lower for blacks and Hispanics, according to a 2003 report from the U.S. Department of Education.

Much of the progress has occurred in one institution: community colleges. These colleges have grown enormously, now enrolling nearly half of all college students and providing access for new groups of students. During the past 40 years, enrollment doubled in four-year colleges, but increased fivefold in public two-year community colleges.

However, community colleges have shockingly low degree-completion rates. A national survey found that of newly entering community college students planning to get a degree, only 34% complete any degree in the eight years after high school. In fact, many students leave with no new qualifications: no degrees and often no credits. For students who get no degree, college provides little or no labor market benefit, according to a recent study by David Marcotte and colleagues at Columbia University.

Given the nation’s increasing reliance on these institutions, there is an urgent need to figure out whether they are contributing to the serious problem of low degree-completion rates, and, if so, how educators and policymakers can solve this problem. It is not clear whether the problem is caused by deficiencies in community colleges or if it is related to deficiencies in the students attending these colleges. Nor is it clear how to improve outcomes. Our recent studies, which are summarized below, address both questions.

These questions arise because community colleges have evolved rapidly, with little clear design. Now that they enroll nearly half of all college students, a careful analysis of how they operate and of possible alternatives is long overdue. Our studies indicate some serious problems and suggest alternative procedures that might make them more effective. Many of these procedures can be implemented by community colleges themselves, but they require additional resources and policy support.

Degree-completion rates differ greatly at different types of colleges. Public two-year colleges have much lower overall completion rates than either public four-year colleges or private two-year colleges. However, to understand whether these differences are related to institutional influences, one must examine institutions that enroll comparable students. We used rigorous statistical methods first to examine the characteristics of students who attend different types of colleges and second to examine college effects on degree completion for comparable students.

We found that different college types enroll different students. Both public and private four-year colleges draw from the upper end of the grade-point average distribution, whereas public and private two-year colleges enroll more students with lower grades. Within the two-year sector, public and private two-year colleges have distributions that are not significantly different.

Using a 28-variable multivariate model, we find that students’ predicted propensity to attend public four-year colleges overlaps little with that for public two-year colleges. What this means in practical terms is that most students at two-year colleges would not be in college if two-year colleges did not exist. Because students at these colleges are not comparable, it does not make sense to ask how most students who attended a two-year college would have fared at a four-year college. Indeed, in this national sample, relatively few of the students are comparable and the comparable students are atypical.

However, students attending private and public two-year colleges have considerable overlap. This suggests that for most students at private two-year colleges, entering a public community college would have been a realistic alternative. Therefore, attainment-rate comparisons between these two types of institutions are meaningful.

Although private colleges charge $9,000 more per year in tuition on average, financial aid helps to close the gap. Whereas community colleges rarely assist students in getting financial aid, private two-year colleges assist every student. Combining federal and state grants can reduce or even eliminate the tuition-cost difference. In quantitative and qualitative analyses, we detect few differences in the kinds of students at the two types of college. Both serve large numbers of low-income and minority students who did poorly in high school and are looking for a second chance.

To examine college effects on degree completion for comparable students at these two types of two-year colleges, we matched private two-year college students with similar students in public two-year colleges, based on their propensity scores. For the matched students, the private college effect is calculated as the difference in attainment rates for those entering private versus public two-year colleges. We found that, compared to similar students who enter community colleges, those who enter private two-year colleges are 15% more likely to attain a degree (see Table 1).

TABLE 1
Enrollment and Degree Attainment Rates by College Type (N = 7,360)

College Type % of Total Enrollments Attainment Rate
Private, 2-year 2% 51%
Public, 2-year 37% 34%
Private, 4-year. non-profit 19% 79%
Public, 4-year 42% 65%
Total 100% 56%

Note: Attainment rates refer to attainment of associate’s degree or higher by 2000 by first college attended for the high-school senior class of 1992.

Differences in organizational procedures

Two decades ago, private two-year colleges were typically trade schools, business schools, and technical training schools. Indeed, they were not colleges; they did not offer accredited degrees, and many made fraudulent claims. However, in the 1990s, federal regulations imposed stringent demands on these schools; 1,300 schools went out of business, and the others devoted great efforts to improving degree completion. Although some remain trade schools, others resemble colleges. Five percent became accredited to offer associate degrees similar to those in public two-year colleges, and some developed articulation agreements with four-year colleges. This is a very small sector, but it offers important lessons about alternative procedures.

COMMUNITY COLLEGES HAVE SHOCKINGLY LOW DEGREE-COMPLETION RATES. INFACT, MANY STUDENTS LEAVE WITH NO NEW QUALIFICATIONS: NO DEGREES AND OFTEN NO CREDITS. FOR STUDENTS WHO GET NO DEGREE, COLLEGE PROVIDES LITTLE OR NO LABOR MARKET BENEFIT.

Before our study, little was known about the inner workings of private two-year colleges. In After Admission: From College Access to College Success, coauthored by one of the authors of this article (Rosenbaum), college procedures and students’ experiences at seven community colleges and seven private two-year colleges in a Midwestern metropolitan area were compared. Key differences were discovered in the ways in which these institutions respond to their students’ needs. These differences are especially salient in their organizational procedures, which guide or fail to guide students through college and which may account for some of the differences in graduation rates.

A basic difference is the underlying assumptions that guide their actions. Community colleges assume that students have the know-how to direct their own progress, an assumption that is often faulty. Although students are assumed to possess well-developed plans, we found many students whose plans are vague or unrealistic. Although students are assumed to be highly motivated, we found that student efforts often depend on external incentives. Although students are assumed to be capable of making informed choices, of knowing their abilities and preferences, of understanding the full range of college and career alternatives, and of weighing the costs and benefits associated with different college programs, our analyses show that many students have great difficulty with such choices. We find that many students have poor information about remedial courses, course requirements, realistic timetables, degree options, and job payoffs. Finally, although students are assumed to possess the social skills and job-search skills to get appropriate jobs, many students do not.

In contrast, private two-year colleges design procedures that are not based on these assumptions. Rather than assume that students possess such skills and blame failures on individuals’ deficiencies, private two-year colleges reduce the need for such skills. In effect, these colleges shift the responsibility to the institution, devising procedures to help students succeed even if they lack the traditional social prerequisites of college. Below we outline some of the ways in which these private two-year colleges depart from traditional assumptions to serve new groups of students. These innovative procedures suggest potential reforms that might improve the dismal degree-completion rates of many community colleges and may be useful in other schools and colleges.

Information overload versus “package deal” programs. Community colleges allow students to explore broadly in liberal arts and to progress at their own pace, assuming that students have clear plans and can assess which classes will fulfill those plans. When students have information problems, community colleges respond by piling on more information: more brochures, more catalog pages, and more meetings. For students unfamiliar with college and inexperienced at handling large amounts of information, information overload can result. Moreover, in providing many options, community colleges also create complex pathways, dead ends, and few indications about which choices efficiently lead to concrete goals.

In contrast, private two-year colleges offer students a “package deal” plan for attaining an explicit career goal in a clear time frame. Just as travelers pick a destination and let travel agents arrange all flights, hotels, and activities, students rely on private two-year colleges to offer a structured program that alleviates the burden of collecting information and the risk of making mistakes. The colleges identify a few desirable occupations in high-demand fields, and for each, they create a well-designed curriculum to prepare students in the shortest time and with the lowest risk of failure. This strategy eliminates the problems of directionless exploration, unneeded courses, unexpected timetables, and labor market struggles that we found in community colleges.

Options also overwhelm institutions; community colleges have difficulty offering required courses in the semesters when students need them and during time slots that fit students’ schedules. In contrast, because each private two-year college program stipulates a specific set of courses, even small colleges can offer the necessary courses in the right term and every student can make steady progress. Courses are scheduled back-to-back to limit commuting, and they are scheduled in predetermined time slots so that schedules remain constant throughout the year. This structured curriculum makes information manageable: It reduces information needs, simplifies logistics, and increases clarity and confidence. Students’ progress is clear to students and counselors, which makes advising simple, and mistakes are avoided or easily discovered and corrected. If a third-term business student isn’t in a certain class on the first day, advisors contact the student immediately. Although some students may not need such structured programs, this option is valuable to students who are overwhelmed by navigating the complex college course system on their own and for whom certainty of timetable and completion are a high priority. Although we assume that students prefer flexibility, many community college students complain about the difficulties of taking required courses when they need them. Meanwhile, most students at private two-year colleges enjoy the dependability of course offerings.

ALTHOUGH THEY SOMETIMES POST JOB LISTINGS, SEND OUT TRANSCRIPTS, AND OFFER GENERAL CAREER COUNSELING, PUBLIC TWO-YEAR COLLEGES DO LITTLE TO CONNECT STUDENTS WITH JOBS.

Enhancing motivation with institutional procedures. Community colleges assume that students have the motivation to persevere through the many sacrifices—financial, personal, and academic—required to earn a college degree. However, motivation requires confidence in eventual rewards, and many community colleges inadvertently make it difficult for students to be certain about rewards.

For instance, community colleges go beyond the standard Monday through Friday, 9-to-5 course schedule to offer options for students to take classes in the early mornings, evenings, and weekends. Although well-intentioned, this flexibility often creates complexity, time conflicts, and uncertainty Students have difficulty coordinating work and childcare with these complex class schedules that may occur at any hour of any day and change every semester. They cannot anticipate when courses will be offered in future semesters or whether they can be coordinated with other duties. This uncertainty can decrease some students’ confidence in completing a degree on time.

Private two-year colleges take a different approach. Instead of assuming that students possess adequate motivation, these colleges devise procedures that improve students’ confidence about course-schedule demands. These colleges simplify and compress course schedules into discrete time blocks maintained all year long, which are easily anticipated and coordinated with other demands. When students commit to a program, they commit to certain time blocks, and they do not have to worry about unexpected time conflicts or unavailable courses.

Private two-year colleges also offer compressed terms, which further reduce uncertainties. Whereas community college students must anticipate possible competing obligations over a 14-week semester, private two-year colleges compress class hours into eight-week terms. If a family crisis or another interruption forces a student to withdraw from a term, which is fairly common for nontraditional students, private two-year college students lose only eight weeks of coursework, whereas community college students could lose 14. Whereas associate’s degrees typically take three to six years to complete at community colleges (because of the need to take remedial courses and to deal with course-scheduling difficulties), the same degrees typically take 18 months at some private two-year colleges. Although this requires more class hours per week and fewer vacation weeks per year, shorter timetables reduce the exposure to crises interrupting their schooling.

At these private two-year colleges, all students complete a sequence of compressed milestones. Even if they ultimately seek bachelor’s degrees, which can be completed in as little as 36 months, they first get a certificate (in 9 months) and an associate’s degree (in 18 months). In contrast, community colleges often discourage interim credentials, because some courses required for associate’s degrees do not count towards bachelor’s degrees.

Frequent milestones have both psychological and practical benefits. Psychologically, short-duration units make school seem less formidable, increasing a sense of mastery, which is also associated with increased motivation. Practically, they provide a quick sequence of payoffs, so students who do not reach their bachelor’s degree goals are not left empty-handed. For instance, we interviewed a student aspiring to a bachelor’s degree who became pregnant after 20 months at a private two-year college. Pregnancy forced her to drop out before completing a bachelor’s degree, but she had already earned an associate’s degree, which improved her job prospects and wages.

Many two-year college students face more challenges than the average college student, and motivation and confidence are even more important at these schools, given many students’ poor academic history and lack of college exposure. These students often need more certainty than many community colleges offer. In contrast, private two-year college procedures enhance motivation by helping students see the light at the end of the tunnel and understand the intervening steps to the degree.

Guiding choices, reducing mistakes. Analysts and educators often assume that students have enough information about college requirements to make appropriate choices on their own, and community college procedures reflect this assumption. Whenever budgets are cut, administrators focus on preserving instruction and make cuts in counseling. Unfortunately, we find that many students report difficulties in making choices, and they report making mistakes because of poor information, often not realizing their mistakes until it is too late. Given strong pressures to complete degrees quickly, many students are disappointed to discover that they chose the wrong courses to progress toward a degree or that an associate’s degree with fewer required remedial courses was available and could have been completed in less time.

Whereas community college students make many such mistakes, private two-year colleges use several organizational procedures to inform all students, guide their choices, and prevent errors. At the outset, admissions staff inform all students about the college’s few programs, their requirements, placement rates, expected salary, and working conditions, and they help students choose a program that fits their interests and achievement levels. Choice is reduced to a few options, each with high rates of degree completion and placement in high-demand skill-relevant jobs. Then, they must attend mandatory advising sessions throughout college. Such meetings are arranged by the counselors rather than the students, alleviating the stress placed on the students, many of whom may not initially feel comfortable initiating such frequent contact or may not recognize the value of these meetings. The schools also offer group advisory meetings, which give all students essential information at key points in the curriculum. These meetings also foster peer support when family support is lacking; students can share problems and solutions and become role models and sources of positive peer pressures. As extra assurance to avoid mistakes, these colleges have systematic student information systems that keep track of student attendance and performance and allow advisors to detect and correct mistakes quickly before they become serious. These and other procedures ensure that students make good choices, have adequate information, and do not get off track. Not surprisingly, students at these colleges are more confident that they understand college and program requirements and can complete a degree.

Beyond academic instruction: Teaching soft skills. When students enroll in two-year colleges, they often lack tools that are necessary to enter the labor market. One common deficiency is in “soft skills,” or professionally relevant workplace social skills. These skills include attendance and punctuality, self-presentation and communication skills, and other work habits. Although employers expect students to possess such skills, we found that many community college students lacked them. Community college faculty often recognize this problem, but the colleges encourage instructors to focus on academic rather than social instruction, and the colleges do not provide systematic soft-skill training outside the classroom.

Meanwhile, private two-year colleges offer mandatory advisory sessions and classes that provide all students with individual advice about their dress, demeanor, vocabulary, and oral communication skills. These colleges also set clear rules about attendance, punctuality, homework deadlines, and appropriate dress.

These soft skills may come automatically to students whose parents work in professional workplaces, but many students in two-year colleges do not have such experiences. Although soft skills are not part of the traditional college curriculum, students preparing to enter the working world need such skills, and two-year colleges can provide them.

Connecting graduates to jobs. In addition to preparing students for the workplace, colleges can play a major role in helping graduates find jobs. However, most colleges, including the community colleges in our study, assume that if they provide students with the right skills and credentials, students will find jobs on their own. Although they sometimes post job listings, send out transcripts, and offer general career counseling, they do little to connect students with jobs. Few resources and staff are devoted to such efforts, and what is offered is incomplete and unsystematic. Students are often not aware that the services exist. For middle-class students who can get advice and job leads from family and friends, these optional services may be sufficient, but many two-year college students do not have such connections and sometimes struggle to find suitable employment after graduation.

Private two-year colleges in our study recognize that their students need assistance in finding jobs and legitimizing themselves in the job market. These colleges play an active role in the labor market, making great efforts to enhance employers’ understanding and trust of the college and of students’ qualifications. They also work to improve students’ understanding of employers’ demands.

These colleges offer job-search preparation for students throughout college, including individual career advising, résumé and interview workshops, job fairs, and guaranteed placement assistance. Many of these activities are mandatory for students, and those that are not are strongly encouraged.

Meanwhile, to improve employers’ perceptions of the college and students, private two-year college staff assist all students in résumé preparation. They translate students’ courses into skills that employers recognize and value, and they advise students on how to sell these skills to employers in interviews. To further improve employers’ trust, these colleges also establish long-term personal relationships with employers to provide them with information about graduates’ qualifications. Trust is built because employers understand that placement staff would not jeopardize their future relationship by misrepresenting a dubious student. In turn, staff continue to send employers worthy candidates only if the employers consistently offer their graduates high-quality jobs. Such symbiotic relationships mirror those between elite prep schools and university admissions officers.

In addition to directing the best students to the best jobs, these colleges assist more marginal students. For these students, they find apprenticeships that might lead to permanent jobs, or they highlight hard-to-assess strengths that might not come through on a résumé or in an interview. This is especially useful for disadvantaged students who might not have the polished communication skills to sell themselves to an employer. Again, the colleges’ trusted relationships with employers smooth this process.

The job-placement services at these colleges have the potential to pay off in terms of real labor-market benefits for students after graduation. They can also have a more subtle effect on students during college. Many students are not confident that they can complete a degree and get a good job after college, which can reduce their effort and might lead to dropping out. We found that students who perceive that their college and teachers can help them get a job exert more effort in college and are more confident that they will complete a degree. Perceptions of job assistance are more common at private two-year colleges and might be related to these colleges’ improved completion rates. Although these positive perceptions of job contacts are less common in community colleges, they sometimes exist there; when they do exist, they have the same positive impact on students’ efforts and confidence.

We cannot be certain that the correlation between job-placement services and higher degree completion at private two-year colleges indicates causality, but many students report greater confidence and determination based on the schools’ contacts. These findings imply that student effort and confidence should not be taken for granted; rather, colleges are able to take actions that improve them.

Clearly, community colleges cannot totally emulate private two-year colleges. Community colleges serve many purposes and provide a wide diversity of offerings, including academic, transfer, and certificate programs, as well as basic skills, General Educational Development tests, and English as a second language courses. Moreover, they face different challenges than do private colleges, including severe budget constraints, which have grown worse over time. At the same time, private two-year colleges, even those offering accredited degrees, are not inherently better than community colleges, and we do not argue that all students should choose to attend these colleges instead of community colleges.

However, the dismal degree-completion rates in community colleges are a serious concern. Some observers have called for ending open admissions and remedial courses. These critics believe the problem is primarily academic and that by restricting admission only to students with strong academic skills, degree-completion rates will improve. However, this proposal is not likely to get support from Americans who strongly believe in preserving access to opportunity, especially at a time in which college has become increasingly important. Nor will it solve the problem completely because it ignores an important obstacle to degree completion: the complex procedures that make college progress difficult for many students, including well-qualified students. These obstacles do not arise from open admissions, and although they affect low-achieving students, they affect others as well.

Rather, our findings suggest several actions that have the potential to improve student outcomes that community colleges could adapt from private two-year colleges. Although community colleges cannot implement these procedures college-wide, they could implement them in a few highly structured programs available to those who seek clear choices, a focused curriculum, and timely completion. For others, exploration could remain an option, but it should be designed so that students can be confident of making dependable progress toward a degree.

INNOVATIVE PROCEDURES USED AT PRIVATE TWO-YEAR COLLEGES SUGGEST POTENTIAL REFORMS THAT MIGHT IMPROVE THE DISMAL DEGREE-COMPLETION RATES OF MANY COMMUNITY COLLEGES.

To help students who have vague or unrealistic plans, community colleges could offer students several highly structured programs to attain explicit career goals within a distinct time frame. Such structured programs would reduce information mistakes by counselors, faculty, and students, while permitting colleges to offer required courses each term so that students can make dependable progress. Students should be counseled upon enrollment to decide whether such programs meet their personal needs and goals. Additionally, in large community college systems with several colleges in a relatively compact geographic area, specialization might be useful. Rather than each college offering structured programs in many areas, individual colleges could specialize in a few areas.

To improve students’ confidence and motivation, community colleges could take several further actions. Structured programs could offer clarity about the full costs and benefits of their program options. For all students, colleges can compress educational units into dependable time blocks, shorter terms, and a sequence of intervening short-term credentials (certificates and associate’s degrees on the way to bachelor’s degrees). Compressing the school day, the school week, the term, and vacations allows students to complete obligations more quickly and reduce the risks posed by outside demands and crises. Moreover, dependable schedules and stability from term to term also reduce outside pressures.

Community colleges could also adapt many private two-year college procedures to inform students, guide choices, and prevent mistakes. These procedures include intake advising for choosing programs, frequent mandatory advising, group advising, peer cohorts, and student information systems. Upon enrollment, community colleges currently assess students for assignment in remedial courses and selective programs. These assessments could have additional uses. For instance, advisors could use test results to help students choose among the multiple associate’s degree programs (associates of arts, associates of sciences, associates of applied sciences, and associates of general studies), which vary in difficulty and remedial requirements. Many students (and perhaps even counselors!) do not know about these degree options and the subtle differences among them. Providing this information along with assessments could help students understand their expected timetables and make appropriate choices.

Like private two-year colleges, community colleges could also shift some of the burden of collecting and interpreting information from students to advisors. Some advising (for example, for course selection and time management) can be done in group sessions rather than one-on-one sessions to save money, particularly if students are in similar programs or have similar goals. Mandatory frequent advising and student information systems, which closely monitor students’ progress or difficulties, would be somewhat more expensive for community colleges to implement but could have valuable benefits in keeping students on the right track and catching mistakes early. Peer cohorts could also serve some of the same purposes.

In the way of job preparation, community colleges could teach social skills and work habits more systematically. These skills are already systematically taught in health programs at community colleges and are sporadically taught in other programs by a few faculty members. Traditional conceptions of college are the primary obstacle to such instruction. Once administrators recognize this need among their students, they can offer support and encouragement for teachers to work these skills into existing classes. Additional resources are not necessarily required for such additions. For example, implementing mandatory attendance rules and dress codes costs virtually nothing; they simply require enforcement. Additionally, teachers could be encouraged to incorporate public speaking and group projects into existing courses to improve students’ communication skills.

Finally, community colleges could strengthen and systematize their employer relationships to improve student confidence and job outcomes. They could provide information to employers via trusted conduits, either by providing time for program chairs to work with employers or by employing special job-placement staff. As we have seen, community colleges already have many contacts with employers that are unsystematic and not used effectively. One approach would be to provide time and institutional rewards for faculty who develop these contacts; however, that approach may not reduce conflicting pressures on faculty or the variability and uncertainty across different programs. Alternatively, community colleges could assign these tasks to job-placement staff who create systematic dependable contacts for all students in all programs. Although high variability in contacts across programs and faculty may give rise to student doubts, institutional uniformity can inspire students’ confidence that their efforts will be worthwhile in the end.

Although one must be cautious about inferring causality, a detailed understanding of procedures sometimes leads to compelling causal inferences, even as it helps us understand how outcomes occur. When students experience more information problems with complex procedures than they do with simple ones, or when students express more confidence about job payoffs in colleges where they perceive useful employer contacts, causal inferences are hard to avoid.

As we have seen, schools are more than classrooms, and they implement procedures besides instruction. These procedures influence whether students persist and progress in college and make effective transitions from college to careers. Community colleges (and indeed all colleges) need to consider whether their procedures match students’ needs, especially for nontraditional students.

Designed to be responsive to community needs, community colleges have taken on a wide variety of programs serving many purposes. Our results suggest that offering multiple programs may also reduce program coherence and ultimate degree completion. Private colleges have pursued a different efficiency strategy: They provide coherent programs that lead to dependable progress and degree completion. Community colleges can emulate this model, but to do so, they must recognize the value of coherent programs that use these organizational procedures. Leaders may need to focus resources and perhaps even reject some initiatives that undermine coherence.

These organizational procedures will require additional resources to employ advisors, placement staff, and other programmatic support staff. Although taxpayers are rightly concerned about additional costs, these procedures have proven to be cost-effective in promoting degree completion, even in colleges concerned with profits. Community colleges have begun an impressive revolution that has dramatically improved college access for large numbers of disadvantaged students. To extend this unfinished revolution, new procedures are needed to ensure dependable degree progress and completion.

Tiny Technology, Enormous Implications

The purpose of the U.S. National Nanotechnology Initiative (NNI) is to promote nanoscale science and technology in a way that, so far as possible, benefits U.S. citizens in particular and humanity in general. To this end, the NNI has organized and funded considerable research on the environmental, health, and safety (EHS) aspects of nanomaterials (including associated regulatory capacity and best research and workplace practices) and on education and outreach (involving workforce preparation, educating the public about nanotechnology, and encouraging public acceptance of nanotechnology). However, preemptively identifying and responding to broader social and ethical issues that are likely to emerge as nanotechnologies become widely disseminated has not been a priority within the NNI. This is unfortunate, not only because there are serious social and ethical issues associated with nanotechnology, but also because the nanotechnology revolution invites and the NNI offers a historic opportunity to prospectively consider the broad societal effects of a potentially transformative technology during regulatory and policy design. If this opportunity is seized, the NNI could be an instrument for fostering both technological and social progress.

Nanotechnology, like all technologies, is a thoroughly social phenomenon. Technologies emerge from society. They are made possible and encouraged by society. They are implemented in and disseminated through society, and they in turn have effects on society. Thus, when it comes to identifying and addressing social and ethical issues associated with nanotechnology, the features of both nanotechnology and society are relevant.

Consider, for example, the issue of distributive environmental justice. It is now well established that low-income communities and communities with high minority populations are disproportionately exposed to environmental hazards. What does this have to do with nanotechnology? One possible answer is that although this risk distribution is definitely unequal, probably unjust, and possibly a form of discrimination, it has nothing to do with nanotechnology. Nanotechnology is not the cause of this distribution of environmental hazards. Moreover, there is nothing unjust about the capacity to characterize, control, and construct on the nanoscale or about the practice of doing so. This reasoning would lead one to conclude that the environmental justice issue does not appear to be a nanotechnology issue.

On the other hand, a significant feature of the social context into which nanotechnology is emerging is that enormous inequalities in the distributions of environmental hazards is allowed, and in many ways enabled and encouraged, by existing social institutions and practices. These include the role of cost/benefit analysis in facility-siting decisions, zoning and land planning patterns that are legacies of segregation, the differential political influence of communities that want to block the siting of certain types of facilities, and corporate influence and the marginalization of local communities in land-use decisions. Moreover, even without knowing exactly what nanomanufacturing processes are going to be developed and implemented or the products that they are going to produce, it now appears that many of them will entail potential environmental risks. According to this line of thought, environmental justice is a nanotechnology issue, and responding to it cannot be accomplished through technology design, technological fixes, and risk management alone. It requires addressing the underlying social and institutional causes of environmental injustice.

A CUMULATIVE LEGACY OF THE REACTIVE, PIECEMEAL APPROACH THAT HAS CHARACTERIZED U.S. FEDERAL REGULATION IS A PATCHWORK AND MISMATCH OF REGULATIONS, REGULATORY STRATEGIES, ORGANIZATIONAL STRUCTURES, AND ORGANIZATIONAL RESOURCES THAT ARE NOT OPTIMAL FOR THE PROMOTION AND PROTECTION OF THE PUBLIC GOOD.

Once the significance of the social context of nanotechnology is brought to the fore, social and ethical issues associated with nanotechnology materialize in legion. All manner of problematic features of social contexts are relevant to the implementation, dissemination, control, and oversight of, responsibility for, access to, protection from, benefits and burdens of, and decisionmaking regarding nanotechnology. The upshot for the NNI’s responsible development program is that to be comprehensive it must address the problematic features of the relevant social contexts into which nanotechnology is emerging.

The social context issues associated with nanotechnology concern unequal access to resources and opportunities, institutionalized and non-institutionalized discrimination, differential social and political power, corporate influence and lack of accountability, inadequate governmental capacity, challenges to individual rights and autonomy, marginalization of noneconomic values, technology control and oversight, the role of technology in creating and solving problems, and more generally, those aspects of our society and institutions that fail to meet reasonable standards of justice. Responsible development of nanotechnology must consider how this development will interact with the current social context. This is a job for the NNI.

Moreover, the NNI affords as good an opportunity to address these problems as is ever likely to present itself. There is within the NNI a substantial and apparently genuine commitment to promoting nanotechnology as a social good, as well as a recognition that considerable effort in support of responsible development will facilitate public acceptance of the technology. There also is some acknowledgement that there are significant social and ethical issues, above and beyond public outreach, infrastructure development, and EHS, that need to be addressed. “Other social and ethical issues” do at least find mention (though not specification) in core NNI documents, and there has been some effort within the NNI to identify them, for example in the report Nanotechnology: Societal Implications—Maximizing Benefits for Humanity.

Furthermore, there is awareness within the NNI that substantial policy and regulatory changes may be needed in order to build adequate government capacity for responding to the challenges posed by nanotechnology. It is not often that the federal government openly encourages and financially supports (through the National Science Foundation) rethinking the organization, capacity, mandates, and approaches of its frontline regulatory agencies. This is important because many of the relevant social features that give rise to social context issues are under the authority of federal regulatory agencies; for example, the Environmental Protection Agency (EPA) has a record of being slower to remediate environmental hazards in high-minority communities and was charged with leading the implementation of President Clinton’s Executive Order “Federal Actions to Address Environmental Justice in Minority Populations and Low-Income Populations.” Social context issues certainly do not start and end with federal regulatory agencies, but many of the issues do involve them one way or another. Therefore, consideration of the issues needs to inform assessments of existing governmental capacity and efforts to build additional capacity.

Finally, the NNI is a comprehensive research program along several dimensions, in the number of government agencies involved, the number of disciplines involved, and the types of research (basic, applied, social, and scientific) being pursued. It has already developed substantial intra- and interagency coordination (such as the Interagency Working Group on Nanotechnology Environmental and Health Implications) and coordinators (such as the National Nanotechnology Coordination Office) to help avoid redundancy, define research needs, and share data. Therefore, it affords an opportunity to take an encompassing perspective on the relationship among technology, government, environment, and society in the context of evaluating existing federal regulatory institutions.

The broad, systematic, prospective rethinking of federal regulatory institutions invited by the nanotechnology revolution and encouraged by the NNI is in contrast to how the regulatory landscape developed to look the way it currently does. Historically, regulation to protect and promote the public good has been enacted in response to largely unanticipated problems or crises. A paradigmatic example of this is the regulatory response to the chemical revolution that followed World War II. The story of postwar adoption of a range of synthetic organochlorine pesticides such as DDT is one of unfettered technological enthusiasm, near-indiscriminate use across a range of sectors openly promoted by federal agencies, a stress on industry self-regulation, and little thought (in government at least) about the potentially harmful long-term health effects of these substances on wildlife or people. Concerns about such effects grew more acute as evidence of harm accumulated in the years that followed, but direct regulatory authority lay in the hands of agencies such as the U.S. Department of Agriculture, whose primary role was to promote the use of those same substances for the economic benefit of their clientele. Not until the creation of the EPA in 1970 did protection of the environment enjoy an institutional base within the federal establishment. That journey took nearly a quarter-century and in many respects is far from complete.

A cumulative legacy of the reactive, piecemeal approach that has characterized U.S. federal regulation is a patchwork and mismatch of regulations, regulatory strategies, organizational structures, and organizational resources that are not optimal for the promotion and protection of the public good. Consider food safety, for example. When the first known U.S. case of bovine spongiform encephalopathy, the so-called “mad cow” disease, came to light in December 2003, many Americans no doubt were startled to find that no single federal agency has jurisdiction over the nation’s meat industry. The U.S. Department of Agriculture keeps watch over slaughterhouses and has the authority to recall potentially tainted or diseased meat, but the Food and Drug Administration (located in the U.S. Department of Health and Human Services) monitors cattle feed and the facilities that produce it. Authority over food safety is fragmented among at least 15 federal agencies, including the Department of Homeland Security. This is the result of bureaucratic accretion over time by multiple designers (different Congresses, administrations, and the institutes and agencies themselves), not broad foresight.

A history of regulation by accretion, analogy, and reaction to crises may once have been understandable given the lack of existing precedents, statues, mandates, organizational infrastructures, experience, and public expectations. However, now we have knowledge gained through experience. We have gone through decades of trial and error on different regulatory strategies, ranging from industry self-regulation to “top-down” bureaucratic direction and have studied models from other nations. We have learned quite a lot about effective institutional design and what works in different domains. Moreover, public expectations about government are more clearly defined, and we have a better understanding of how to meet those expectations and the resources required to do it. We have regulatory institutions already in place on which to build. We understand the social and ethical challenges associated with regulating emerging technologies better than we have in the past.

The NNI provides a unique opportunity to make social progress through broadly considered, innovative, forward-looking regulatory and policy design. Certainly, not all of the broader social challenges associated with technology would be resolved. Of course, mistakes would be made. Nevertheless, it would be a shame to let this chance pass. If history is any indication, it could be quite some time before another opportunity of this caliber presents itself.

Water Scarcity: The Food Factor

With so much talk about a global water crisis, about water scarcity, and about increasing competition and conflicts over water, it would be easy to get the impression that Earth is running dry. You could be forgiven for wondering whether, in the not-too-distant future, there will be sufficient water to produce enough to eat and drink.

But the truth is that the world is far from running out of water. There is land and human resources and water enough to grow food and provide drinking water for everyone. That doesn’t mean, however, that the global water crisis is imaginary. Around the world there are already severe water problems.

The problem is the quantity of water required for food production. People will need more and more water for more and more agriculture. Yet the way people use water in agriculture is the most significant contributor to ecosystem degradation and to water scarcity. Added together, these problems amount to an emergency requiring immediate attention from government institutions that make policy, from water managers, from agricultural producers—and from the rest of us, because we are all consumers of food and water.

The crisis is even more complex than it first appears to be because many policies that on the surface appear to have nothing to do with water and food make a bigger difference to water resources and food production than even agricultural and water management practices. But people who make these decisions often do not consider water to be part of them. Water professionals need to communicate these concerns better, and policymakers need to be more water-aware.

In early 2007, the Comprehensive Assessment of Water Management in Agriculture, which explored ways to cope with this crisis, was released. The assessment gathered research and opinions from more than 700 researchers and practitioners from around the world. They addressed these questions: How can water be developed and managed in agriculture to help end poverty and hunger, promote environmentally sustainable practices, and find a balance between food and environmental security? The Comprehensive Assessment provides a picture of how people used water for agriculture in the past, the water challenges that people are facing today, and policy-relevant recommendations charting the way forward. Food and environmental communities joined efforts to produce the assessment, which was jointly sponsored by the United Nations Food and Agricultural Organization, the Convention on Biological Diversity, the Consultative Group on Agricultural Research, and the Ramsar Convention on Wetlands. (A summary of the assessment is available at http://www.iwmi.cgiar.org/Assessment/index.htm and the book at www.earthscan.co.uk.)

Crisis, what crisis?

If there’s plenty of water for drinking and growing food, then what’s the crisis all about? Many in the developed world are complacent about the supply of water and food. Global food production has outpaced population growth during the past 30 years. The world’s farmers produce enough for everyone, and food is cheap. Water resources development, which has played a critical role in fueling agricultural growth, can be seen as one of humankind’s great achievements. Why isn’t the type of water resource development that served us well in the past sustainable?

For one thing, agriculture must feed another 2 to 3 billion people in the next 50 years, putting additional pressure on water resources. More than 70% of the world’s 850 million undernourished people live in rural areas, and most depend directly or indirectly on water for their livelihoods. Yet for millions of rural people, accessing enough food, enough water, or both is a daily struggle. Rain may be plentiful for some farmers, but in many places it falls when it is not needed and vanishes during drought. The Indian rural development worker Kalpanatai Salunkhe put it succinctly: “Water is the divide between poverty and prosperity.”

In addition, policies seemingly unrelated to water drive increased water use. For example, using biofuels may be a way to reduce greenhouse gases, but growing the crops to produce them demands additional water. Increased reliance on biofuels could create scarcity by pushing up agricultural water use. In India, increased biofuel production to meet 10% of its transportation fuel demand by 2030 will require an estimated 22 cubic kilometers more irrigation water, about 5% of what is currently used in Indian food production, pushing the country further into water scarcity. India can ill afford these additional water resources.

Trade has the potential to markedly reduce water use. Yet trade policies rarely if ever take water into account. As a first step, trade officials could consider the water implications of trade. Subsidies and economic incentives lead to better soil and water management. Countries set subsidy policies as an economic incentive. If farmers have access to cheaper fertilizer or water, or the prospect of higher prices for their crops, they will invest in better practices. But agricultural subsidies consider a country’s political interests (such as rural employment) rather than water. Subsidies in countries such as the United States allow cheaper food to be exported and drive down the prices of commodities such as corn and wheat. Farmers in Africa and poor countries elsewhere then have trouble competing with these artificially low prices. Local, national, and international policymakers should carefully consider the water implications of their actions along with local politics.

How much water do we eat?

The water-food-environment dilemma starts with everybody because everybody eats. The water people need for drinking is essential, but it is only about 0.01% of the water people require to produce their food.

Why does food production need so much water? It is largely because of the physiologic process of plant transpiration. Huge amounts of water are evaporated constantly from pores on the surface of a plant’s leaves. This evaporation is part of the process of photosynthesis, in which a plant manufactures its own energy from sunlight. Evaporation also helps cool the plant and carries nutrients to all its parts. In addition to transpiration, some liquid water is turned to vapor through evaporation from wet soils or leaves.

Crop yield is roughly proportional to transpiration; more yield requires more transpiration. It takes between 500 and 4,000 liters of evapotranspiration (ET, the combined process of evaporation and transpiration) to produce just one kilogram of grain. When that grain is fed to animals, producing a kilogram of meat takes much more water—between 5,000 and 15,000 liters. Thus, vegetarian diets require less water (2,000 liters of ET daily) than do high-calorie diets that include grain-fed meat 卌

The bottom line is that although people individually need just 2 to 5 liters of drinking water and 20 to 400 liters of water for household use every day, in reality they use far more: between 2,000 and 5,000 liters of water per person per day, depending largely on how productive their agriculture is and what kind of food they eat. An estimated 7,100 cubic kilometers of water are vaporized to produce food for today’s 6.6 billion people. On average, each of us requires about 1,000 cubic meters of water each year for food, or about 3 cubic meters (3 tons, or 3,000 liters!) of water per day. For country-level food security, about 2,800 to 3,000 calories must reach the market in order for each of us to consume about 2,000 calories. Thus, about one liter of water is required per calorie of food supply.

Water for crops comes either directly from rain or indirectly from irrigation. Growing food with rainwater has much different water and land-use implications than does intensive irrigation. Meat produced on rangeland uses much less water than industrial meat production in feed-based systems. In addition, although both grazing and industrial livestock systems need water, the soil moisture in grazing land cannot be piped into a city and therefore does not reduce the domestic water supply, although it does reduce the amount of water available to the natural ecosystem that is being grazed.

The importance of meat to water consumption and livelihoods is quite different in developed and developing countries. Animal products are extremely important in the nutrition of families who otherwise consume little protein. They are also precious to African herders and farmers who use livestock for transport, for plowing, for living food storage, and often for a walking bank account as well. In the developed world, by contrast, most livestock production is for meat and comes from industrial feed-based processes.

Reaching the limits

Every year, the rain falling on Earth’s surface amounts to about 110,000 cubic kilometers. About 40,000 cubic kilometers contributes to rivers and groundwater. The remainder evaporates directly from soil. People withdraw 3,700 cubic kilometers from rivers and aquifers for cities, industries, and agriculture. Agricultural irrigation takes most of that: 2,600 cubic kilometers or 70% of total withdrawals. Agriculture also consumes 7,100 cubic kilometers per year through ET, about 80% of which comes directly from rain and 20% from irrigation. Rainfall supplies plenty of water for food production. But often it fails to rain in the right place or at the right time.

Limits have already been reached or breached in several river basins. These basins are “closed” because people have used all the water, leaving just an inadequate trickle for the ecosystem. The list of closed basins includes important breadbaskets around the Colorado River in the United States, the Indus River in southern Asia, the Yellow River in China, the Jordan River in the Middle East, and the Murray Darling River in Australia.

Many agricultural and city users prefer groundwater, the underground water in aquifers and streams beneath Earth’s surface that supplies springs and wells. The present boom in groundwater use for irrigation that began in the 1970s is occurring because this water is easy to tap with cheap pumps and the supply is reliable. But for millions of people, the groundwater boom has turned to bust as groundwater levels plummet, often at rates of 1 to 2 meters per year. Groundwater is declining in key agricultural areas in Mexico, the North China plains, the Ogallala aquifer in the U.S. high plains, and in northwest India.

Patterns of water use are also changing in response to changes in the amount of grazing land and the productivity of fisheries. Further expansion of grazing is unlikely to be available to support expanded meat and milk production, so more livestock will have to come from industrial feed-based systems. That will require more water, especially for feed production. Ocean and freshwater fisheries have in many cases surpassed their limits, yet consumption of fish and fish products is booming. So in the future, more fish products will come from aquaculture, which requires yet more fresh water.

Water scarcity resulting from physical, economic, or institutional constraints is already a problem for one-third of the world’s population. About 1.2 billion people live in areas plagued by physical water scarcity, meaning they lack enough water to satisfy demand, including enough water to sustain ecosystems. These are Earth’s deserts and other arid regions. Physical water scarcity also occurs in areas with plenty of water, but where supply is strained by the overdevelopment of hydraulic infrastructure. Another 500 million people live where the limit to water resources is fast approaching. All of these people are beginning to experience the symptoms of physical water scarcity: severe environmental degradation, pollution, declining groundwater supplies, and water allocations in which some groups win at the expense of others.

Economically water-scarce basins are home to more than 1.5 billion people. In these places, human capacity or financial resources are likely to be insufficient to develop local water, even though the supply might be adequate if it could be exploited. Much of this scarcity is due to the way in which institutions function, favoring one group while not hearing the voices of others, especially women. Symptoms of economic water scarcity include scant infrastructure development, meaning that there are few pipes or canals to get water to the people. Even where infrastructure exists, the distribution of water may be inequitable. Sub-Saharan Africa is characterized by economic water scarcity. Water development could do much to reduce poverty there.

Both economic and physical water scarcity pose special problems that can be particularly difficult to deal with. But, as we have said, water problems also occur in areas with adequate water. Institutions—laws, rules, and a supportive organizational framework—are key to mitigating water problems. Where there is inequitable water distribution or ecosystem degradation, water problems can be traced back to ill-adapted or poorly functioning institutions. Rarely is there an overriding technological constraint.

As economies develop and people’s incomes rise, their diets tend to change. In developed areas, more grain is grown for feeding animals than for feeding people. The reverse is true in sub-Saharan Africa, where grains are a major part of the human diet. With economic development, the trend is toward much more meat in the diet, as in East Asia. There, average annual meat consumption is expected to double, from 40 to 80 kg per person, by 2050.

With growing incomes and changes in diet worldwide, food and feed demand could double by the year 2050. If there is no increase in water productivity—the amount of water it takes to produce a unit of food—water consumed by agriculture must double as well. The environmental impact of that massive human demand for water would be stunning. Therefore, the amount of food per unit of water, which has tended to grow in the past, needs to grow much faster.

Water for more food

There are five main options for getting water for more food:

  • Expand irrigated areas by diverting more from rivers, lakes, and aquifers
  • Expand rain-fed areas by turning more natural area into arable land
  • Get “more crop per drop” through increases in water productivity
  • Trade food from areas of high to low water productivity
  • Look beyond water and crops by managing demand through dietary changes or reduced food wasting

Irrigation has been the key water resources development strategy in Asia and the Western industrialized countries: Build dams, divert water to irrigate crops, and intensify production. Irrigation has succeeded in combating famine and poverty and has helped stimulate economic growth in early stages of development; for example, in India and China. Particularly in Asia, this achievement is often referred to as the Green Revolution, which combined improved crop varieties with increased chemical fertilizer use and irrigation. In Asia there were few other options, because the population density in many countries precluded converting land to agriculture.

In Africa, on the other hand, the key strategy has been the opposite: to expand the area under cultivation with very little irrigation or agricultural intensification. Latin America has adopted a mixed strategy.

A downside of irrigation expansion is its several effects on aquatic ecosystems. Dams fragment rivers. Increased ET causes river flows to diminish and groundwater levels to drop. Intensive irrigation has led to closed basins where all water is allocated to specific uses, including water for the environment. In fact, irrigation has been the single most important reason for closing river basins and creating physical water scarcity.

Nevertheless, the continued expansion of irrigated land remains an important strategy. Storing water behind dams or in groundwater is arguably an important way of coping with climate change because it helps reduce uncertainties of supply. Scenario analysis shows that irrigation could contribute 55% of the total value of food supply by 2050, up from 45% today. But that expansion would require 40% more water to be withdrawn for agriculture, surely a threat to many aquatic ecosystems and fisheries. Fisheries would compete with irrigated crops for water. Highly nutritious fish products, important for some of the poorest of the poor, are threatened when water is diverted to crops.

Sub-Saharan Africa is a special case because there is now so little irrigation there. Irrigation expansion seems warranted. Doubling the irrigated land in sub-Saharan Africa would increase irrigation’s contribution to the food supply from only 5% today to, optimistically, 11% by 2050.

Typical water productivity figures for the staple cereal crops rice and wheat are 0.5 kilogram per cubic meter in low-performing irrigation systems, 0.2 kilogram per cubic meter in rain-fed sub-Saharan Africa, and up to 2 kilogram per cubic meter in both Asian state-of-the-art irrigation systems and rain-fed systems in Europe and North America. Today, 55% of the gross value of our food is produced by rainfall on nearly 72% of the world’s cropland.

Rain-fed agriculture could be upgraded to meet food and livelihood needs through better management, not just of water but also of soil and land. These tactics can increase water productivity, adding a component of irrigation water through smaller-scale interventions such as rainwater harvesting: capturing rain before it gets to rivers by building small earthen dams across streams or diverting water from roads or rooftops into storage.

At the global level, the potential for rain-fed agriculture is large enough to meet present and future food demand through increased productivity alone. An optimistic scenario, in which farmers reach 80% of the maximum practically obtainable yield, assumes significant progress in upgrading rain-fed systems while relying on minimal increases in irrigation. This leads to annual growth of 1%, increasing an average rain-fed yield of 2.7 metric tons per hectare in 2000 to 4.5 tons in 2050. From 1961 to 2000, the clearing of land expanded the cropped area by 24%, at the expense of terrestrial ecosystems. But with productivity gains, expansion can be limited to 7% from now until 2050, in spite of the rising demand for agricultural commodities. The Millennium Ecosystem Assessment identified agricultural land expansion as the most important driver of ecosystem change, so limiting this expansion would have important ecological payoffs.

But it has been extremely difficult to improve yields from rainfall alone. If adoption rates of improved technologies are low and yield improvements do not materialize, the rain-fed cropped area required to meet rising food demand by 2050 would need to expand by 53% instead of 7%. Globally, the land for this is available. But additional natural ecosystems would have to be converted to agriculture, which would encroach on marginally suitable lands and add to environmental degradation.

There are reasons to be optimistic about water productivity gains. There is still ample scope for higher physical water productivity in low-yielding rain-fed areas and in poorly performing irrigation systems, where poverty and food insecurity prevail. Good agricultural practices—managing soil fertility and reducing land degradation—are important for increasing crop per drop. The Comprehensive Assessment reveals scope for improvements in livestock and fisheries as well, which is important because of the growing demand for meat and fish. Farmers and water managers can do these things with the right incentives.

But caution and care must be mixed with this optimism. There are misperceptions about the scope for increasing physical water productivity. Much of the potential gain in physical water productivity has already been met in high-productivity regions. There is less water wasted in irrigation than commonly thought. Irrigation water is often reused locally or downstream; farmers thirsty for water do not carelessly let it flow down the drain. A water productivity gain by one user may be a loss to another. Upstream gain may be offset by a loss in fisheries, or the gain may put more agrochemicals into the environment.

But increases in yield almost always require that more water be transformed to water vapor through ET. Most gains in water productivity can be made by increasing yields in areas of the world where yield is extremely low, roughly 1 to 2 tons per hectare. Doubling crop yield by improved soil and water management can actually triple water productivity in these areas, because plants stressed by thirst perform so poorly and because there is excess evaporation from soils.

Today’s low-yielding areas can generate the biggest increases in water productivity. These are the rain-fed areas of sub-Saharan African and South Asia, where improved soil fertility combined with better water management can make big differences. Adding supplemental irrigation will be a key. A second payoff is that these are areas with a lot of rural poverty and few jobs outside agriculture. Increases in agricultural productivity can boost incomes and economic growth.

Where yields are already fairly high, say 6 tons per hectare, increasing yield by one-third typically takes about one-third more water. Still, even at these higher yields water productivity can be bettered, although improvements are more difficult to obtain.

Major gains and breakthroughs, such as those in the past from breeding and biotechnology programs, are much less likely to take place in the future. In fact, the Comprehensive Assessment concluded that although breeding had played the most significant role in water productivity gains in the past, today it is improved management that is most likely to generate more increases. Drought- and disease-resistant varieties are crucial for reducing the risks of farming, but higher yields from these crops tend to consume more water. Perhaps a breakthrough will come by breeding traits of water-efficient crops (such as maize and sugarcane) and low-transpiration crops (such as cactus and pineapple) into the more common but thirstier crops (such as wheat and barley).

Many view water pricing as the way to improve water productivity by reducing water waste in irrigation. But this has proven extremely difficult to implement because of political realities and lack of water rights. Gains are also hard to realize because of the complex web of hydrological flows. But well-crafted incentives that align society’s interest in using water better with farmers’ interest in profitable crops still hold promise. One such incentive: Urban users could compensate farmers for moving water originally intended for irrigation (and stored behind dams) from agriculture to cities facing rising demand.

There is more reason to be optimistic about increasing economic water productivity. Switching to crops with higher value or reducing crop production costs both lead to higher economic water productivity. Integrated approaches—agriculture/aquaculture systems, better integrating livestock into irrigated and rain-fed systems, using irrigation water for households and small industries—all are important for increasing value and jobs per drop.

Increases in physical and economic water productivity reduce poverty in two ways. First, targeted interventions enable poor people or marginal producers to gain access to water or to use it more productively for nutrition and income generation. Second, the multiplier effects on food security, employment, and income can benefit the poor. But programs must ensure that the gains reach the poor, especially poor rural women, and are not captured by wealthier or more powerful users. Inclusive negotiations increase the chance that all voices will be heard.

Can trade avert water stress?

By importing agricultural commodities, a country “saves” the amount of water it would have required to produce those commodities domestically. Many contend that this trade in virtual water—the equivalent water it takes to grow food—could solve problems of water scarcity. Egypt, a highly water-stressed country, imported 8 million metric tons of grain from the United States in 2000. To produce this amount of grain Egypt would have needed about 8.5 cubic kilometers of irrigation water, a substantial proportion of Egypt’s annual supply from Lake Nasser of 55.6 cubic kilometers.

The cereal trade has a moderating impact on the demand for irrigation water because the major grain exporters—the United States, Canada, France, Australia, and Argentina— produce grain with highly productive rainfall. A contrasting example is found in Japan, a land-scarce country and the world’s biggest grain importer. Japan would require an additional 30 billion cubic meters of crop water to grow the food it imports. A strategic increase in international food trade, and thus trade in virtual water, could mitigate water scarcity and reduce environmental degradation. Instead of striving for food self-sufficiency, water-short countries would import food from water-abundant countries. But there are forces working against this trade.

Poor countries depend, to a large extent, on their national agriculture sector, and they often lack funds to buy food from the world market. At present, for example, Uganda and Ethiopia simply cannot afford to buy their food from other countries, and even if they could, getting it to people through the local marketing system would be a daunting task. Struggling with food security, these countries remain wary of depending on imports to satisfy basic needs. Even countries such as India and China that could afford to import more food instead of expanding irrigation may instead embrace a politically appealing degree of national food self-sufficiency. Australia, on the other hand, is a major exporter of food and virtual water in spite of scarce water and the environmental problems arising from it.

At present, countries trade for economic or political reasons, not for water. So it is unlikely that food trade will solve water scarcity problems in the near term. But water, food, and their environmental implications should enter more firmly into discussions of trade.

Looking for more water

Where else can water gains be found? Water resources rarely enter the discussions of livestock scientists and managers, and if they do, the talk usually concerns livestock drinking water. But water needed to generate food for livestock far surpasses what animals need for drinking. Yet these are areas where significant increases could be found. Colleagues at the International Livestock Research Institute have shown that the water productivity of livestock could easily be doubled or tripled by, for example, changing the type of food fed to animals or enhancing the production of milk, meat, and eggs. Better grazing practices could help reduce the environmental impact. There are large gains to be had in aquaculture systems too, but these are rarely quantified.

In addition, policies that focus on diets could have a profound impact on water resource use. Although for many people undernourishment is a key concern and better diets an issue, the opposite is also true. Households in the developed world waste as much as 20% to 30% of their food, and therefore the water it took to produce it. In developing countries much food is wasted too, particularly in moving it from farm to market. And although overeating may not waste food, it still wastes water.

The ultimate cause of our water problems is inadequate institutions. Behind water scarcity, unequal distribution of benefits from water development, and failure to take advantage of known technologies lie policies, laws, and organizations that influence how water is managed. With rapidly growing cities, expanding agriculture, and changing societal demands, the water situation is changing rapidly in most places in the world. Yet institutions rarely adapt rapidly enough to keep pace. Reform is needed.

A prime example is the slow adoption of productivity-enhancing measures. Technologies that boost water productivity are known or could be readily developed, but the institutional environment does not support it. Risk-averse farmers are unlikely to invest in water technologies or improved management practices if there might be a dry spell that will ruin crops. In much of sub-Saharan Africa, crops could be grown, but there is no market or else no roads to take the goods to market. Farmers are asked to employ water-saving technologies that benefit cities, but rarely are there sufficient incentives and compensation for farmers to do so.

Compounding this are the hydrologic complexities brought about by the increasingly intertwined nature of water users. The development of upstream water for crops may take water away from downstream fisheries, but there is no mechanism to bring both types of agricultural producers to the table to discuss the issue. Institutions need to become much better at integrating policies across sectors and at using science to see opportunities and pitfalls when making changes.

Donor agencies and international institutions have advocated a host of panaceas—water pricing, water markets, farmer management of irrigation systems, drip irrigation— using blueprint solutions, donor funds, and leverage to hasten reforms. It is frustrating when these ideas are ignored. A major reason is that reforms are simply not right for local conditions. For example, new river basin organizations may be promoted, but they ignore or replace informal arrangements that already exist.

What is needed is a reform of this reform process, one in which solutions can be better crafted to meet local needs in the specific political and institutional context. This will require building coalitions among the partners. Civil society and the private sector are key actors. Government institutions are key, too, but often the slowest to take up reform.

Actions are required now. Here are some possibilities:

  • All of us should think about the water implications of the food we eat—and waste.
  • Consumers and the private sector should be prepared to pay the environmental costs of food production.
  • Politicians and trade negotiators should consider the water implications of trade and energy use and pay the water costs.
  • Governments should fund the development of water for food.
  • City dwellers should compensate farming communities for water that is taken away from them.
  • Governments should set up mechanisms for negotiating water disputes.
  • Governments, civil society, and the private sector should spend time and money to empower poorer water users to compete equally with wealthier ones.

We tend to defer these choices to the next generation, which will feel the consequences of scarcer groundwater or ecosystem degradation. But we can learn from the mistakes of the past. We can provide incentives to produce more food with less water. All of us and our governments should recognize that there are limits to water, and that more and more water is not always a solution.

The University As Innovator: Bumps in the Road

For much of the past century, universities and university-based researchers have played a critical role in driving technological progress. In the process, universities have been a strong catalyst for U.S. economic growth. But a perennial challenge related to university-driven innovation has been to ensure that university structures help, not hinder, innovation and its commercialization. This challenge has been growing in recent years, and if universities fail to address it, they could gradually lose their global leadership in innovation, and U.S. economic growth could suffer.

The Bayh-Dole Act of 1980 was supposed to make commercialization easier, faster, and more productive by clearing the way for universities to claim legal rights to innovations developed by their faculty using federal funding. But with new rights have come new layers of administration and often bureaucracies. Rather than implementing broad innovation and commercialization strategies that recognize different and appropriate pathways of commercialization, as well as multiple programs and initiatives to support each path, many universities have channeled their innovation-dissemination activities through a centralized technology transfer office (TTO).

We spent the past several years discussing the role of TTOs with multiple university leaders and researchers. Although we found that some universities have enabled their TTOs to disseminate innovations effectively, in too many other cases university leaders have backed policies that encourage TTOs to become bottlenecks rather than facilitators of innovation dissemination. Where this has happened, it is because TTOs have been charged with concentrating too heavily on maximizing revenues from the licensing of university-developed intellectual property rather than on maximizing the volume of innovations brought to the marketplace. It is vital that universities begin to emphasize the latter, and there are a number promising of ways to do so.

Financing university research

For several decades after World War II, most R&D in the United States was financed by the federal government, specifically through the National Science Foundation (NSF), the National Institutes of Health (NIH), and the Department of Defense (DOD). By 1979, industry R&D expenditures surpassed government spending, growing more than threefold (after controlling for inflation) between 1975 and 2000. By comparison, although government-funded R&D rose quickly after the war, since 1975 it has inched up about 75%, according to 2006 NSF data. Government-funded R&D has focused, appropriately, more on basic than on applied research, whereas the priorities of private R&D spending have been on development.

Industry performance of government-funded R&D rose quickly from 1955 to the early 1960s but has since fluctuated significantly. Conversely, universities and colleges have shown a steady acceleration in their R&D performance, particularly in basic research. Today, more than half of basic research is conducted in universities. And although much less is spent on basic than on applied science, the absolute number of dollars of funding going into basic science is a misleading indicator of its importance, because basic science stands at the base of the economic pyramid. It is breakthroughs in basic science, after all, that have created new industries.

U.S. institutions of higher learning and their research output appear to be in good shape, remaining atop the standard global rankings. But there are disturbing signs beneath the surface. For one thing, the United States has experienced stagnant-to-declining levels of industrial R&D investment, decreasing industry/university co-authorships, and decreasing citations of U.S. science and engineering articles by industry. There is some indication that foreign-sourced R&D is being driven in part by access to foreign universities and that the type of science is driven primarily by access to and the quality of university faculty.

Anecdotally, it also appears that relative to some foreign universities, U.S. universities are becoming less friendly to collaborations and commercialization. In particular, U.S. universities historically have benefited significantly from an inflow of R&D capital from U.S. affiliates of foreign companies, particularly European companies. These benefits are threatened, however, by a growth in bureaucracy and an increasing and shortsighted emphasis by U.S. universities on securing intellectual property rights to inventions by their faculty. If these two trends continue, the flow of R&D funding from these U.S. affiliates is likely to slow, if not reverse.

In short, if the U.S. economy is to continue its rapid pace of economic growth, it will be necessary not only to adopt innovations from other parts of the world but also to make investments in basic research in a setting that supports commercialization, spillovers, and general interactions between academic researchers and industry.

The rise of university technology transfer

In 1923, Harry Steenbock, a University of Wisconsin biochemistry professor, demonstrated a means of fortifying vitamin D in food and drugs through a process called irradiation. Although this was a major breakthrough, it wasn’t long before Steenbock became concerned about how the technology would be implemented. Specifically, he recognized that unqualified individuals or organizations could use his invention and possibly do harm unless he brought it to market with the legal protection of a patent. The University of Wisconsin declined his offer of patent ownership. Working with alumni, Steenbock instead created the Wisconsin Alumni Research Foundation (WARF), a separate entity that was university-affiliated and could accept patents, license them out, and disperse revenues back to the inventor and the university without exposing the university to potential financial and political liability. Thus, in 1924 the nation’s first TTO was conceived, although in unusual fashion, given that WARF does not operate directly under university control.

By the 1960s and 1970s, formal endorsement of technology transfer from federally funded research was bubbling up on the policy agenda. The Department of Health, Education, and Welfare, NIH, and DOD began to grant to selected universities the rights to patent inventions that resulted from their government-funded research. But these rights were often negotiated, and the bureaucracy that this created frustrated many, including then-Senator Robert Dole, who said that “rarely have we witnessed a more hideous example of over-management by the bureaucracy.”

Congress passed the Bayh-Dole Act largely to address this problem and to accelerate the commercialization of federally funded research that yielded promising new technologies. Bayh-Dole had the practical effect of standardizing patenting rules for universities and small businesses, something that previous conflicting laws had not done. The federal government was off the hook, and universities were given the opportunity and obligation to commercialize innovations resulting from federal funding.

Bayh-Dole came into effect at a time when government support for universities had begun to decline. Thus, it made sense for many universities to look to technology transfer—and the offices that were in charge of it, the TTOs—as a new potential source of revenue. Indeed, championing commercialization came to be viewed almost as a core university activity on some campuses. The proliferation and growing importance of TTOs that followed Bayh-Dole were not, however, the stated goals of the legislation, but rather its byproducts.

UNIVERSITY ADMINISTRATION HAS TO REFOCUS AWAY FROM THE HISTORIC PATENT-LICENSING BIG-HIT MODEL TO ONE OR MORE VOLUME MODELS THAT CONCENTRATE ON THE NUMBER OF AND SPEED WITH WHICH UNIVERSITY INNOVATIONS ARE SENT OUT THE DOOR AND INTO THE MARKETPLACE.

Today’s technology transfer system

Although some basic research investments at universities have been successfully commercialized through the technology transfer process, the cumulative impact has been something of a disappointment. Commercialization of university research (whether judged by numbers of patents, licensing of revenue, or new companies formed) remains differentially successful and largely concentrated in just a handful of universities.

There are a variety of explanations for the shortcomings in the technology transfer process, but the fundamental one is structural: Many universities have established the TTO as a monopoly, centralizing all university invention and commercialization activities and requiring all faculty to work through these offices by notifying them of their discoveries and delegating to them all rights to negotiate licenses on their behalf.

In addition, many university administrations have often rewarded TTO offices and their personnel on the basis of the revenues they generate rather than on the volume of inventions that the universities transfer or commercialize. We label this current system the revenue maximization model of technology transfer, even though there is some evidence to suggest that universities structure their TTO operations to maximize revenues only in the short term.

There are several flaws in the revenue maximization model of university technology transfer. One is that the current reward structure and the centralization that accompanies it have created incentives for TTOs to become gatekeepers rather than facilitators of commercialization. This is less the fault of the TTO staff than it is of how their offices are structured: with the majority of financial and human resources dedicated to patent licensing, and minimal resources (materials, tools, and software) dedicated to nonpatented innovations. But the net effect is that TTOs, like any monopoly, do not have incentives to maximize output—the actual numbers of commercialized innovations—but only to maximize revenues earned by the university.

This, in turn, leads to a home-run mentality, in which many TTOs focus their limited time and resources on the technologies that appear to promise the biggest, fastest payback. Technologies that might have longer-term potential or that might be highly useful to society as a whole, even if they return little or nothing in the way of licensing fees (such as research tools used mainly by other researchers), tend to pile up in the queue, get short shrift, or be overlooked entirely.

How predominant is the revenue maximization model among TTOs? One study published in 2005 (by Gideon Markman of the University of Georgia and colleagues) found that the principal mechanism favored by most TTOs was licensing for cash (72%), with licensing for an equity stake and sponsored research being less popular at 17% and 11%, respectively. These interview-based findings were confirmed by the researchers in a review of TTO mission statements, which showed a heavy focus on licensing and protection of the university’s intellectual property and are consistent with research in this area published in 2001 by Marie Thursby and Jerry Thursby of Georgia Tech and Emory University, respectively, and Richard Jensen of the University of Notre Dame, which found that revenue, licensing, and inventions commercialized all drive TTOs.

With revenue maximization as a central goal, it is not surprising that most technology transfer activities are portrayed as linear processes in which research is performed, inventions are disclosed, technology licenses are executed, income is received, and wealth is generated. But the process of technology transfer is much more complex. It is critical for universities to better appreciate that patenting and licensing of research are not the only means or even the most important means of transferring new knowledge to the market. As Don Siegel of the University of California, Riverside, and colleagues have pointed out, universities have a range of outputs, including information, materials, equipment and instruments, human capital, networks, and prototypes. The means by which these outputs are diffused, especially to industry, vary across universities. Measuring university success in spawning innovation solely by licensing or patenting activities, therefore, almost certainly masks the importance of these other means of knowledge diffusion.

These other means include nonpatent innovations, startup companies launched by university faculty or related parties, and consulting engagements between industry and faculty. A study by the Thursbys published in 2005, for example, indicated that approximately 29% of patents with public-university faculty inventors were assigned to firms rather than to the university, which indicates a significant degree of faculty/industry engagement.

Meanwhile, university faculty members are learning how to maximize their own self-interest within a general environment that impels TTOs to maximize revenue. In particular, and not surprisingly, faculty members engaged in commercialization activities are becoming more competent in these endeavors. One measure of this is the substantial increase in rates of disclosure of innovations over time by faculty, perhaps the best indicator of university-based technology transfer at the faculty level.

Still, as an earlier 2003 study by the Thursbys has documented, university commercialization activity remains highly concentrated within the university itself, with somewhat less than 20% of university faculty having engaged in patent disclosure of any kind. Further, there is a trend toward greater university ownership of research and commercialization, reflected in the significant increases in university patenting, increased contributions to R&D spending, and proliferation of university spinoffs and research parks.

Although spinoffs from universities are few in number, they are disproportionately high-performing companies and often help to bridge the development gap between university technology and existing private-sector products and services. According to the Association of University Technology Managers, although only 3,376 academic spinoff companies were created in the United States from 1980 to 2000, fully 68% of these companies remained operational in 2001. A 2003 study by Brent Goldfarb of the University of Maryland and Magnus Henrekson of the Stockhom School of Economics estimated that 8% of all university spinoffs had gone public, which is 114 times the going public rate for U.S. enterprises generally. As impressive as these figures are, they actually understate the extent of university-based entrepreneurship because they do not include startup companies represented in business plan competitions, back-door entrepreneurial activities emerging out of faculty consulting, and general spillovers from graduate students creating companies tied to outcomes of university research.

There must be a better way of advancing university inventions. Commercialization policies can and must be structured to realize the social benefits of a greater number of innovations. The question is how.

Bolstering university innovation

Universities commercialize the innovations developed by their faculty largely by licensing the intellectual property in these breakthroughs (typically patents) to entrepreneurs, to the faculty members themselves, or to established companies. Historically, faculty and students have generated a range of innovations that have found their way into the market and have helped launch new companies. The Internet browser Netscape, Internet search engine Google, and various biotechnologies (such as Genentech) are just a few examples. There are, however, strong reasons to believe that the objectives of Bayh-Dole could be met even more effectively.

During the 1980s and 1990s, most universities had little experience in negotiating with industry and considering commercialization activities. With time and experience, however, universities and, more important, faculty have gained expertise in the invention and commercialization processes. As individual university and academic cultures have evolved, some universities have begun to recognize that commercialization and innovation activities are too varied and extensive to be run by a single office and require cross-university programmatic initiatives in the classroom and the laboratory. Examples of universities that have moved in this direction include MIT (with a high number of faculty members who have been founders of startup companies), the University of Arizona, and the University of California. Examples within the University of California (UC) system include the BioInfoNano R&D Institute, which is an effort to create a commons around shared work while still respecting the interests of member companies and startups; UC Berkeley’s one-stop shop for industry research partners; and Berkley’s leadership in implementing its socially responsible licensing program.

As these new forms emerge, or more accurately, as TTOs become just one component of the innovation and commercialization ecosystem, technology transfer will increase in efficiency, volume, and quality on most college campuses. Indeed, technology will be best diffused by recognizing and taking advantage of the decentralized nature of innovation and university faculty who participate in this process.

It is also important to consider university culture in fostering and supporting entrepreneurial activity among faculty. The shrinking gap in disclosure and other entrepreneurial activities by women, for example, is evidence that incremental changes in practice can have important effects on university culture. Janet Bercovitz of Duke University and Maryann Feldman of the University of Georgia also have found, in their study of two prominent medical schools, that disclosure increased when a faculty member was at an institution with a tradition of disclosure, observed others in a department disclosing, and worked in a department with a chair who actively disclosed innovations derived from its research.

Because of the importance of faculty researchers to innovation and commercialization, a university culture that is accepting of entrepreneurial activities is best built from the ground up by researchers who promote and connect other colleagues inside and outside of academe. But how can universities support the development of entrepreneurial capabilities in their faculty?

In our view, the answer does not lie in an expanded role for TTOs. Many research faculty members are likely to have better opportunity-recognition skills, both scientific and entrepreneurial, than do TTO professionals. Academic researchers have spent years working in their fields, and they have incentives within their disciplines to recognize avenues for scientific advances and breakthroughs. Furthermore, researchers’ social capital (their professional relationships with their peers inside and outside the academy) gives them a greater ability to link scientific opportunity recognition to entrepreneurial opportunity recognition.

To be sure, these opportunity-recognition skills, particularly regarding commercial opportunities, take time to develop. Many university campuses have experienced a gradual cultural change since the passage of Bayh-Dole, and they now face the challenges of defining multiple pathways to support university innovation and commercialization and redefining the role of TTOs.

It has been suggested that TTOs should reorganize in ways that would reduce the potentially substantial transactions costs involved in moving scientific discoveries more rapidly into the marketplace. Those costs include tangible and intangible expenses related to the identification, protection, and modification of innovation and commercialization, as well as the administrative expenses and the opportunity costs of the time that would need to be invested by researchers. To reduce these costs, it has been suggested that TTOs adopt something like a value chain model that encourages universities to disaggregate their functions, slicing and dicing a range of what are considered to be technology transfer functions and assigning them to specialists, while leveraging outside organizations and other partners in the process.

IT IS CRITICAL FOR UNIVERSITIES TO BETTER APPRECIATE THAT PATENTING AND LICENSING OF RESEARCH ARE NOT THE ONLY MEANS OR EVEN THE MOST IMPORTANT MEANS OF TRANSFERRING NEW KNOWLEDGE TO THE MARKET.

We build on this basic concept, recognizing both the comparative advantage of faculty in opportunity recognition and the limited budgets of university administration. In particular, we believe that universities must recognize that patenting is only one of many pathways from innovation to marketplace. Specifically, we suggest a move from a licensing model that seeks to maximize patent-licensing income to a volume model that emphasizes the number of university innovations and the speed with which they are moved into the marketplace.

In fact, there are multiple volume models, but they share several features. They provide rewards for moving innovations into the marketplace, rather than simply counting the revenue they may return. They focus on faculty as the key agents of innovation and commercialization. And they emphasize further standardization of the interactions of campuses with their faculty and with industry.

There are four basic variations of the volume model, all with advantages and drawbacks.

Free agency. Under this approach (the name of which we borrow from the sports world), faculty members are given the power to choose a third party (or themselves) to negotiate license arrangements for entrepreneurial activities, provided that they return some portion of their profits to the university. The TTOs can be one of the third parties offering services, but other parties can also compete on a range of services and experience offered.

WARF is an exemplar of such a model. WARF is independent of the university, and Wisconsin faculty members are not obligated to use it except in the case of federal funding. As a practical matter, however, nearly all of them use WARF because the organization has acquired expertise over time that is viewed to be valuable.

Free agency introduces a strong dose of competition to the university TTO, while giving academic researchers the freedom to seek out the best arrangement on the speediest terms to commercialize their innovation. This model is best suited for innovations in which faculty members have deep commercial expertise and social networks to facilitate commercialization.

One drawback to free agency, however, is that university faculty members often lack the resources to pay for patent searches and applications, functions now performed by the TTO. This problem might be overcome through profit-sharing arrangements between researchers and their lawyers or third-party commercialization agents.

Regional alliances. A second possible model provides more technology transfer activities via regional alliances, provided that those alliances operate in ways to maximize volume rather than licensing income. Under this approach, multiple universities form consortia that develop their mechanisms for commercialization. Economies of scale allow for lower costs of the commercialization functions overall, and the universities are able to share these costs among the multiple participants.

This model may prove particularly attractive for smaller research universities that may not have the volume to support a seasoned and highly able licensing and commercialization staff independently. WARF, through the WiSys Technology Foundation, is experimenting with more of a regional approach to technology transfer and has had positive results so far. This type of hub-and-spoke model is effective when supported by experienced staff and dedicated local resources.

There are two principal concerns about the regional alliances model, however. First, a regional TTO with insufficient resources may try to behave like a super TTO, seeking to maximize licensing revenue for the consortium as a whole rather than the number of commercialization opportunities and the speed with which they are moved out the door. In addition, regional models may face coordination challenges or disputes over attribution of inventiveness, with one or more universities pitted against others when a commercial opportunity is realized through the joint work of several researchers at different universities. The probability of disputes is probably related to the amount of money at stake.

Internet-based approaches. Closely related to the regional alliance model, these approaches use the Web to facilitate commercialization. Given their structure, Internet matchmaking approaches, which seek to match those who have ideas and those who want to implement them, are inherently built to maximize volume rather than licensing income.

An example of this approach is www.ibridgenetwork.com, a Web-based platform launched in January 2007, operated by the Kauffman Innovation Network and funded by the Kauffman Foundation. Universities joining the iBridge Network are able to post information about their innovations directly on the site, which provides an alternative pathway to research tools, materials, and nonexclusive licensed technologies that should accelerate university innovation and lower transaction costs. Its success remains to be seen, but initial Web traffic suggests that the program has had an auspicious start.

Faculty loyalty. In this model, universities would relinquish their intellectual property rights altogether, in anticipation that loyal faculty will donate some of the fruits of their success back to the university. Although surrendering rights to faculty may seem drastic, this strategy offers the ultimate incentive for the external agents of commercialization to engage in the process.

In fact, the United States has a great tradition of philanthropy, and this model allows administrators to focus on the core activities of a university while securing additional operational dollars through the virtuous cycle of giving. There is a history of successful faculty members donating some of their profits back to the university. Jan T. Vilcek, for example, pledged $105 million to the New York University School of Medicine in 2005, largely as the result of royalties earned from Remicade, a drug invented by Vilcek and a colleague while working at the school’s Department of Microbiology. Other examples abound, including George Hatsopoulos’s gifts to MIT and James Clark’s generosity toward Stanford.

The obvious downside to the loyalty model is the inherent and significant risk. There is always the possibility that successful academic entrepreneurs will not voluntarily share their success with their employers. This risk is even greater for universities that have difficult relationships with their faculty.

For most universities, however, this risk is worth taking. Academics pursue their work in large part because they have a thirst for knowledge and discovery. Financially successful professors who give back to their universities will set positive examples for their colleagues to follow. Furthermore, the loyalty model avoids the haggles associated with intellectual property rights and, therefore, would theoretically promote more rapid commercialization of inventions than would either of the other models. In particular, the loyalty model should entail very low risks for well-run universities that promote collegiality.

Remaining competitive

U.S. universities today are not only competing with other U.S. institutions for collaborative relationships with industry, they are also both collaborating and competing within a global economy. U.S. institutions must continue to be leaders in research, the advancement of innovation, and the commercialization of ideas in order to remain competitive.

The majority of university/industry agreements relate to technologies that are many years away from being commercialized, and universities cannot take on the burden of forecasting uncertain commercial returns. This function is best performed by the private sector. In the end, society will be best served by a knowledge transfer system that encourages interactions between universities and industry but also inspires each party to capitalize on its relative advantage, with universities focusing on discovery and entrepreneurs devoting their efforts to commercialization.

The issue of how innovations are transferred from universities to industry is an important part of the current national conversation about U.S. economic competitiveness. This country is now at a critical point in which the incentives of some universities (or specific officials within the universities) may lead to the codification of a system that would inhibit rather than promote the commercialization of technological breakthroughs. The most effective way to avoid this outcome is to refocus university administration away from the historic patent-licensing big-hit model to one or more volume models that concentrate on the number of and speed with which university innovations are sent out the door and into the marketplace. These models will include open-source collaborations, copyright, nonexclusive licensing, and a focus on developing the social networks for graduate students and faculty to commercialize all types of innovations.

The federal government, as the funding source for university-based research, is in an ideal position to encourage experimentation with these and other alternative arrangements. At a minimum, the government can help educate universities regarding the importance of providing a more fluid environment that will allow for more rapid commercialization of ideas developed by students and faculty. More ambitiously, agencies of the federal government can and should condition their research grants on university demonstrations that they are experimenting with and using multiple pathways to provide competition or advance innovations into the commercial market.

From the Hill – Summer 2007

Major bills to boost U.S. competitiveness advance

Congress appears poised to approve major legislation to boost U.S. economic competitiveness, with Senate approval of the America COMPETES Act (S. 761) and House passage of the 21st Century Competitiveness Act (H.R. 2272). Although there are major overlaps in the two bills, there are also differences that must be worked out in conference. Also, if a joint measure is finally approved, it is unclear whether appropriators will be able to find the money in a tight budget to fund the increases in spending that the bills authorize. Meanwhile, the Bush administration has expressed concern about the “dramatic increases” in authorized funding levels in the bills.

H.R. 2272 bundles together a number of bills previously approved by the House, including a bill that would put the National Science Foundation (NSF) on track to double its budget in 10 years by authorizing increased funding during the next three years. NSF would be authorized to spend $21 billion during the fiscal years 2008 to 2010; $16.4 billion would be for research and $2.8 billion for education programs.

H.R. 2272 also includes the Sowing the Seeds through Science and Engineering Research Act (H.R. 363), which would allow NSF and the Department of Energy (DOE) to provide grants worth up to $80,000 a year to scientists and engineering researchers in the early stages of their careers. In addition, the 10,000 Teachers, 10 Million Minds Science and Math Scholarship Act (H.R. 362) authorizes more than $600 million over five years for NSF’s Robert Noyce Teacher Scholarship program for college students studying math and science who would like to pursue a teaching career. Eligible students would receive annual scholarships of $10,000 and would be obligated to teach at an elementary or secondary school for four years after graduation. The bill also requires the NSF director to establish a national panel of experts “to identify, collect, and recommend” K-12 math and science teaching materials that have proven effective.

H.R. 2272 authorizes increases in the budget of the National Institutes of Standards and Technology (NIST) over three years, putting the agency on a path to doubling its budget in 10 years. NIST would receive a total of $2.5 billion during fiscal years 2008 to 2010. NIST’s beleaguered Advanced Technology Program (ATP) would be renamed the Technology Innovation Program (TIP) and continue to allow national laboratories and universities to develop partnerships with industry and compete for program grants. TIP would be authorized at $400 million in fiscal year 2008. The Bush administration favors eliminating ATP.

The Senate’s America COMPETES bill (America Creating Opportunities to Meaningfully Promote Excellence in Technology, Education, and Science Act) would double NSF’s budget by fiscal year (FY) 2011, put DOE’s Office of Science on track to double its budget in 10 years, and boost research at NIST laboratories. It would create an Advanced Research Projects Authority-Energy (ARPA-E) at DOE, similar to the successful Defense Advanced Research Projects Agency program at the Department of Defense. It expands funding for the Noyce Scholarship Program and invests in a range of education programs that range from Advanced Placement and International Baccalaureate courses for high-school students to graduate fellowship programs.

However, the COMPETES bill also funds a host of other agency education programs that the House bill does not. For example, it funds grants for teacher training, Math Now programs, and foreign language education. It also includes provisions that touch a broader range of agencies. For example, although it does not authorize specific funding levels for the National Aeronautics and Space Administration (NASA) and the National Oceanic and Atmospheric Administration (NOAA), it does state that the agencies should be an integral part of the federal innovation strategy. Furthermore, it calls on NASA to create a Basic Research Council and coordinate with NSF, DOE, and the Department of Commerce on physical sciences, engineering, and mathematics basic research. The legislation also requests that the White House Office of Science and Technology Policy hold another innovation summit and that the National Academy of Sciences conduct a study on barriers to innovation.

Although both chambers have made innovation and competitiveness a priority and have outlined their visions of how best to establish a national response, whether they will be able to reach a compromise during the conference process remains to be seen.

Support grows for capping and trading carbon emissions

Support appears to be growing in Congress for introducing a cap-and-trade system for limiting greenhouse gas emissions that contribute to global warming. Recently, the debate has focused on how such a system would be structured.

At a February 28 House Ways and Means Committee hearing, Pew Center on Global Climate Change President Eileen Claussen said that many industry representatives prefer a cap-and-trade system to a tax because carbon prices are set by the market. Leaders from the utility industry also supported an economy-wide national cap-and-trade program during a March 20 House Energy and Commerce Subcommittee on Energy and Air Quality hearing. Witnesses stressed the need for meaningful timelines that depend on technological availability and recommended that most of the reductions take place down the road. They agreed that a cap-and-trade system should contain a limit on the price of emissions (in effect, a safety valve), a feature opposed by many environmentalists.

Other recommendations for the structure of a cap-and trade program came during other hearings in the Senate and the House. In these hearings, lessons from existing programs, including the European trading scheme for greenhouse gases and the U.S. acid rain program, focused on key themes such as keeping a system simple, transparent, long-term, and accountable. In more specific terms, witnesses discussed how the setup of a program would affect the distribution of the cost, looking at factors such as how allowances are distributed, who receives the permits, whether they are provided by auction or gratis, and how baseline levels are calculated. Witnesses also agreed that unrestricted trading and the ability to transfer credits across time periods (the banking of allowances) cuts down on price volatility.

Those in favor of cap-and-trade programs have several new proposals to consider. In mid-April, Sens. Thomas Carper (D-DE) and Lamar Alexander (R-TN) introduced two similar multi-pollutant bills that deal with emissions, including carbon dioxide, from power plants. The bills have similar goals for reducing emissions of mercury, sulfur dioxide, and nitrogen oxide. Although the two senators had cosponsored a similar bill in 2006, they disagree on how to establish baselines for emissions. Carper’s bill bases credits on how much energy is produced, whereas Alexander focuses on the amount of fuel historically used by the power plant.

Carper’s bill, the Clean Air Planning Act of 2007, limits carbon dioxide emissions from power plants to 2006 levels by 2012 and to 2001 levels by 2015, and then reduces them 1% annually from 2016 to 2019 and 1.5% percent annually beginning in 2020. Carper’s bill would phase in a system in which some pollution credits would be auctioned, with a move to an entirely auction-based system by 2036. The bill would provide incentives to bring new clean coal technologies on line. It also allows companies to purchase “offsets” of their emissions from other sectors of the economy, with large opportunities projected for agricultural offsets.

Alexander’s Clean Air/Climate Change Act of 2007 differs in its allocation of permits, with 75% of the allowance allocated based on historical emissions and 25% sold in an auction. The bill would freeze emissions at the 2006 level starting in 2011 and go down gradually to 1.5 billion metric tons in 2025.

In the House, more than 120 members joined Rep. Henry Waxman (DCA) to introduce H.R. 1590, the Safe Climate Act of 2007, to reduce greenhouse gas emissions 80% below 1990 levels by 2050. The bill establishes an economy-wide cap-and-trade system that would effectively freeze greenhouse gas emissions in 2010, cut emissions by roughly 2% a year until reaching 1990 levels by 2020, and then cut emissions by 5% a year after 2020. Proceeds from the auctioning of allowances would be dedicated to supporting new energy technology R&D, compensating consumers for increases in energy costs, providing transition assistance for affected workers, and supporting adaptation projects.

Although economists have touted the efficiency of a carbon tax, few in Congress appear willing to support a new tax of any kind. However, two proposals for such a tax were made recently.

Rep. Peter Stark (D-CA), a longtime supporter of carbon taxes, introduced the Save Our Climate Act on April 26. The bill would levy a tax of $10 per ton of carbon content on coal, petroleum, and natural gas at the point at which they are initially removed from the ground or imported into the United States. The tax would increase by $10 each year, freezing when a mandated report by the Internal Revenue Service and DOE determined that carbon dioxide emissions had decreased by 80% from 1990 levels.

Sen. Chris Dodd (D-CT) brought the issue of a carbon tax to the presidential campaign trail in April. The centerpiece of Dodd’s energy proposal, which aims to reduce greenhouse gas emissions 80% by 2050, is a corporate carbon tax that would produce $50 billion annually in revenues to fund research, development, and production of renewable energy technologies. Dodd said he supports cap-and-trade systems, as do many of the other presidential candidates, but in combination with a tax.

Bill to establish national ocean policy falters

Several years after the completion of two landmark reports on the oceans, comprehensive ocean policy legislation finally received hearings in the House, but it is not ready to sail through just yet. Although most members and witnesses supported more coordinated management of the oceans at the March 29 and April 26 hearings of the House Natural Resources Subcommittee on Fisheries, Wildlife, and Oceans, many expressed concern about possible negative, unintended consequences of the bill’s provisions.

H.R. 21, the Oceans Conservation, Education, and National Strategy for the 21st Century Act (OCEANS-21), was introduced on the first day of the 110th Congress by Rep. Sam Farr (DCA) and other members of the House Oceans Caucus. During the March hearing, Admiral James Watkins, chair of the U.S. Commission on Ocean Policy, noted that this is the only bill to establish a national ocean policy. The legislation, which has been introduced several times previously, seeks to establish a National Oceans Adviser for the president and federal advisory bodies on ocean policy, as well as codify a Committee on Ocean Policy and a Council of Advisors on Oceans Policy. The bill calls for improved federal agency coordination of ocean resources, support of regional ocean governance, and establishment of an ocean trust fund.

The bill would also codify the functions of NOAA, a key recommendation of the U.S. Commission on Ocean Policy and the Pew Oceans Commission. OCEANS-21 creates an undersecretary of commerce for oceans and atmosphere and makes that person the administrator of NOAA.

At the hearing, some witnesses expressed concern about the provisions in OCEANS-21 that would judge federal actions by whether they would “significantly harm” the health of a marine ecosystem or “significantly impede” restoration. They feared this language would make federal agencies vulnerable to lawsuits and add another layer of review that would make it more difficult for scientists to undertake research. Witnesses also questioned possible conflicts between provisions in the bill that establish regional partnerships and the fishery councils that were codified during last year’s reauthorization of the Magnuson-Stevens fisheries bill.

On the Senate side, the Commerce Committee easily passed a similarly titled—but different—bill, the Ocean and Coastal Exploration and NOAA Act (OCEAN ACT, S.39), by voice vote on February 13. The legislation, sponsored by Sen. Ted Stevens (R-AK), is similar to a bill passed by the Senate last year. It authorizes a little more than $1 billion for ocean exploration, research, and mapping during the next decade. Highlights include interdisciplinary ocean voyages to survey little-known areas of the marine environment; the development of new undersea technologies; and a focus on ocean exploration in deep sea regions, the location of historic shipwrecks and submerged sites, and public education programs. The bill now awaits consideration by the full Senate.

Senate committee approves energy package

In a 20-3 vote in early May, the Senate Energy and Natural Resources Committee approved a bill (the Energy Savings Act, S. 1321) aimed at reducing oil consumption by 20% in 10 years through a combination of advanced biofuels, improved efficiency, and carbon capture and storage technologies. However, its Senate passage was called into question when Environment and Public Works Committee Chair Barbara Boxer (D-CA) introduced a similar bill that has garnered more support from the environmental community.

S. 1321 would increase biofuels investments by 50% during the next two years. R&D investments would emphasize advanced biofuels derived from non-corn biomass. The bill mandates a renewable fuel standard that requires the nation to produce 36 billion gallons of biofuels by 2022 and provides industries with various incentives and loan guarantees to meet this target.

The bill would also set new standards for energy-efficient equipment, establish fuel-saving targets, and strengthen federal energy efficiency requirements. The proposed efficiency standards are expected to save more than 50 billion kilowatt-hours per year and require the federal government to curb its energy use. The bill authorizes competitive grants for energy-efficiency research and encourages the development of vehicle-efficiency technologies.

The bill would increase carbon capture and storage R&D funding, authorizing up to $120 million to improve these technologies and conduct assessments of potential storage sites and capacities in the Unites States. It directs DOE to research the risk that carbon dioxide would leak from storage sites. The bill extends seven regional carbon capture and storage partnerships involving industry, academia, and all levels of government that are now slated for expiration in 2009, and it authorizes large-scale demonstration plants to improve carbon capture and injection technologies.

In approving the bill, the Energy and Natural Resources committee managed to sidestep, at least for now, some strong support in the Senate for a controversial proposal: funding technology to convert abundant coal reserves to liquid fuel for transportation. The issue will probably reemerge when energy legislation is debated on the Senate floor.

The day after the energy bill was approved, Sen. Boxer introduced her bill, the Advanced Clean Fuels Act of 2007 (S. 1297), which would increase renewable fuel production to 35 billion gallons by 2025. Like S. 1321, a fuel would have to emit at least 20% less greenhouse gas than conventional gasoline in order to qualify under the Environmental Protection Agency’s Renewable Fuel Standard. However, Boxer’s bill would eventually increase the standard to at least 75% less greenhouse gas emission. S. 1297 also gives more attention to environmental management practices of renewable fuels production, including sustainable land use, bringing it broad support from the environmental community.

Congress boosts budget spending limit, despite veto threat

Congress on May 17 approved a FY 2008 budget resolution that would boost funding for nondefense programs, including R&D, by $21 billion above President Bush’s budget request. The vote sets in motion a possible confrontation with the president, who has threatened to veto appropriations bills that exceed his request.

The additional $21 billion would allow nondefense programs overall to increase slightly ahead of inflation, instead of declining as in the president’s request. Given that federal R&D investments have historically been roughly one out of every seven dollars in discretionary spending, the budget resolution could mean $3 billion or so more than the president’s request for R&D programs.

The additional $21 billion could go a long way toward turning steep requested cuts for R&D into flat funding or increases. The president’s budget proposal calls for large increases for three priority programs: research funding in the three physical sciences agencies that make up the president’s American Competitiveness Initiative (NSF, DOE’s Office of Science, and NIST’s laboratories), development funding at NASA for new spacecraft, and development funding for new weapons systems at the Department of Defense.

But within the overall declining nondefense budget, nearly all other R&D programs would see their funding fall in FY 2008, including most environmental research programs, biomedical research at the National Institutes of Health (NIH), and even nonpriority funding within priority agencies such as NASA’s research portfolio and NIST’s extramural programs. The budget resolution’s $954 billion total for discretionary spending could allow appropriators to sustain the requested increases for the American Competitiveness initiative, but also to boost funding for NIH and other agencies whose budgets would be cut.


“From the Hill” is prepared by the Center for Science, Technology, and Congress at the American Association for the Advancement of Science (www.aaas.org/spp) in Washington, D.C., and is based on articles from the center’s bulletin Science & Technology in Congress.

U.S. Competitiveness: The Education Imperative

U.S. competitiveness and the country’s standing among our global counterparts have been persistent issues in public policy debates for the past 20 years. Most recently they have come to prominence with the publication of reports from the National Academies, the Electronics Industries Alliance, and the Council on Competitiveness, each of which argues that the United States is in danger of losing out in the economic competition of the 21st century.

There is no single cause for the concerns being raised, and there is no single policy prescription available to address them. However, there is widespread agreement that one necessary condition for ensuring future economic success and a sustained high standard of living for our citizens is an education system that provides each of them with a solid grounding in math and science and prepares students to succeed in science and engineering careers.

Unless the United States maintains its edge in innovation, which is founded on a well-trained creative workforce, the best jobs may soon be found overseas. If current trends continue, along with a lack of action, today’s children may grow up with a lower standard of living than their parents. Providing high-quality jobs for hard-working Americans must be our first priority. Indeed, it should be the central goal of any policy in Congress to advance U.S. competitiveness.

The United States is in direct competition with countries that recognize the importance of developing their human resources. The numbers and quality of scientists and engineers being educated elsewhere, notably in China and India, continue to increase, and the capabilities of broadband communications networks make access to scientific and engineering talent possible wherever it exists. The result is that U.S. scientists and engineers must compete against their counterparts in other countries, where living standards and wages are often well below those of the United States. Policies for maintaining U.S. competitiveness must consider how to ensure that U.S. scientists and engineers are educated to have the skills and abilities that will be in demand by industry and will allow them to command salaries that will sustain our current living standards.

Because the foundation for future success is a well-educated workforce, the necessary first step in any competitiveness agenda is to improve science and mathematics education. Unfortunately, all indications are that the United States has some distance to go in preparing students for academic success in college-level courses in science, mathematics, and engineering. Current data show that U.S. students seem to be less prepared than their foreign contemporaries.

The National Assessment of Educational Progress (NAEP), often referred to as the nation’s report card, has tracked the academic performance of U.S. students for the past 35 years. Achievement levels are set at the basic (partial mastery of the knowledge and skills needed to perform proficiently at each grade level), proficient, and advanced levels. Although student performance in mathematics improved between 1990 and 2000, most students do not perform at the proficient level. In the NAEP assessment for grades 4 and 8 in 2003 and for grade 12 in 2000, only about one-third of 4thand 8th-grade students and 16% of 12th-grade students reached the proficient level.

In science, progress has also been slow. Between 1996 and 2000, average NAEP science scores for grades 4 and 8 did not change, and grade 12 scores declined. For grades 4 and 8 in 2000, only about one-third of 4th- and 8th-grade students achieved the proficient level, and only 18% achieved that level by grade 12.

The United States also fares poorly in international comparisons of student performance in science and mathematics, such as the Program for International Student Assessment (PISA), which is coordinated by the Organization for Economic Cooperation and Development (OECD). PISA focuses on the reading, mathematics, and science capabilities of 15-year-olds and seeks to assess how well students apply their knowledge and skills to problems they may encounter outside of a classroom. In the recently released 2003 PISA results, U.S. students, compared with contemporaries in 49 industrial countries, ranked 19th in science and 24th in mathematics. U.S. students’ average science scores did not change from the first PISA assessment in 2000, whereas student scores increased in several OECD countries. Consequently, the relative position of U.S. students declined as compared with the OECD average.

A separate set of international comparisons—the Third International Mathematics and Science Study (TIMSS)— tracked the performance of students in three age groups from 45 countries. Although U.S. 4th-grade students performed quite well (above the international average in both mathematics and science), by the 8th grade, U.S. students scored only slightly above the international average in science and below the average in mathematics. By the 12th grade, U.S. students dropped to the bottom, outperforming only Cyprus and South Africa. The TIMSS results suggest that U.S. students actually do worse in science and mathematics comparisons the longer they stay in school.

Boosting teacher expertise

Although these findings are not encouraging and there are no simple answers for how to improve K-12 science and mathematics education, doing nothing is not an option. The place to start is to reduce the number of out-of-field teachers. Research has indicated that teachers play a critical role in students’ academic performance. It is unlikely that students will be proficient in science and mathematics if they are taught by teachers who have poor knowledge of their subjects.

The urgency of solving this problem is evident. For example, 69% of middle-school students are taught by math teachers with neither a college major in math nor a certificate to teach math. 93% of those same students are also taught physical science by teachers with no major or certificate. Although the situation at the high-school level improves, even there 31% of students are taught by math teachers with neither a college major in math nor a certificate to teach math. Likewise, 67% of high-school physics students are taught by similarly unqualified teachers.

Even teachers with basic science or mathematics proficiency may still be poorly prepared to teach these subjects. In a 1997 speech, Bruce Alberts, then president of the National Academy of Sciences (NAS), pointed out that one of the most informative parts of the TIMSS survey was a series of videotapes showing randomly selected teachers from the United States and Japan teaching 8th-grade math classes. The results of expert reviews of the taped classes found that none of the 100 U.S. teachers surveyed had taught a high-quality lesson and that 80% of the U.S. lessons, compared with 13% of the Japanese, received the lowest rating. Clearly, content knowledge must be combined with pedagogical skill to achieve the best educational outcomes.

In 2005, I and several of my colleagues on the House Science and Technology Committee asked NAS to carry out an assessment of the United States’ ability to compete and prosper in the 21st century. In particular, we asked NAS to chart a course forward, including the key actions necessary for creating a vital, robust U.S. economy with well-paying jobs for our citizens. NAS formed a panel of business and academic leaders ably chaired by Norm Augustine, the former chairman of Lockheed Martin. The panel conducted a study that was neither partisan nor narrow and subsequently released a report in the fall of 2005 called Rising Above the Gathering Storm.

The NAS report outlines a number of actions to improve the U.S. innovation environment. Its highest-priority recommendation addresses teachers. In particular, the report states that “laying the foundation for a scientifically literate workforce begins with developing outstanding K-12 teachers in science and mathematics.” The report calls for recruiting 10,000 of the best and brightest students into the teaching profession each year and supporting them with scholarships to obtain bachelor’s degrees in science, engineering, or mathematics, with concurrent certification as K12 science or mathematics teachers.

I believe the report was right on target in identifying teachers as the first priority for ensuring a brighter economic future. To implement the recommendations, I introduced legislation in the last Congress, which was approved by the House Science and Technology Committee, and have introduced largely similar legislation in the current Congress (H.R. 362).

The legislation provides generous scholarship support to science, mathematics, and engineering majors willing to pursue teaching careers, but even more important, it provides grants to universities to assist them in changing the way they educate science and mathematics teachers. It is not sufficient just to encourage these students to take enough off-the-shelf education courses to enable them to qualify for a teaching certificate. Colleges and universities must foster collaborations between science and education faculties, with the specific goal of developing courses designed to provide students with practical experience in how to teach science and mathematics effectively based on current knowledge of how individuals learn these subjects. In addition to early experience in the classroom, students should receive mentoring by experienced and expert teachers before and after graduation, which can be especially helpful in stemming the current trend in which teachers leave the profession after short tenures. Teachers who emerge from the program would combine deep knowledge of their subject with expertise in the most effective practices for teaching science or mathematics.

This approach is modeled on the successful UTEACH program, pioneered by the University of Texas (UT), which features the recruitment of science majors, highly relevant courses focused on teaching science and mathematics, early and intensive field teaching experiences, mentoring by experienced and expert teachers, and paid internships for students in the program.

The UTEACH program, which began as a pilot effort in 1997 with 28 students, has grown to more than 400 students per year. It has been successful in attracting top-performing science and mathematics majors to teaching careers. UTEACH students have average SAT scores and grade point averages that exceed the averages for all students in UT’s College of Natural Sciences. Moreover, a high proportion of graduates from the program remain in the classroom. 75% of UTEACH graduates are still teaching five years past graduation, which is well above the national average of 50%.

In addition to improving the education of new teachers, my legislation provides professional development opportunities for current teachers to improve their content knowledge and pedagogical skills. The activities authorized include part-time master’s degree programs tailored for in-service teachers and summer teacher institutes and training programs that prepare teachers to teach Advanced Placement and International Baccalaureate courses in science and mathematics.

NSF’s key role

The legislation I authored would house most of these education programs at the National Science Foundation (NSF). I strongly believe that NSF’s role is key to success because of the agency’s long history of accomplishment in this area, its close relationship with the best scientists and engineers in the nation, and its prestige among academics and educators in math and science education, which is unmatched by any other federal agency.

The effectiveness of NSF programs in attracting the participation of science, math, and engineering faculty in K12 science and mathematics education initiatives is demonstrated by the NSF Mathematics and Science Partnership (MSP) program, which aims to improve science and mathematics education through research and demonstration projects to enhance teacher performance, improve pedagogical practices, and develop more effective curricular materials. The program focuses on activities that will promote institutional and organizational change both at universities and in local school districts. It is highly competitive, with a funding rate of 8% in the 2006 proposal cycle. Through the summer of 2006, the program has funded 72 partnerships involving more than 150 institutions of higher education, more than 500 school districts, more than 135,000 teachers, and more than 4.1 million students. Approximately 50 businesses have also participated as corporate partners.

A major component of the MSP program is teacher professional development. Grant awards under the program require substantial leadership from disciplinary faculty in collaboration with education faculty. Of the 1,200 university faculty members who have been involved with MSPs, 69% are disciplinary faculty, with the remainder principally from education schools.

THE MOST REMARKABLE ASPECT OF THE DEBATE ABOUT THE SUPPLY AND DEMAND FOR S&T WORKERS AND THE EFFECTS OF OFFSHORING IS THAT THE ARGUMENTS ARE BASED ON VERY LITTLE FACTUAL DATA.

The MSP grants are large enough to allow the awardees to implement substantial, sustained, and thorough professional teacher development activities. For example, the Math Science Partnership of Greater Philadelphia involves 13 institutions of higher education and 46 school districts. This partnership targets teachers of grades 6 through 12, spanning the full breadth of mathematics and science courses and encompassing a wide geographical region, with a focus on the densely populated Philadelphia suburbs.

The preliminary assessment data for the MSP program show that the performance of students whose teachers are engaged in an MSP program improves significantly. Initial findings from nine MSP programs, involving more than 20,000 students, shows that 14.2% more high-school students were rated at or above the proficient level in mathematics after one year with a teacher in an MSP program. This reverses the national trend in which a declining number of students achieve this rating each year. Not all of the preliminary data show such dramatic improvement: The corresponding figure for middle-school students is 4.3%, and the first data evaluating improvement in science suggest that gains are more modest than they are in mathematics.

It is too soon to expect final evaluations of the MSP partnerships. The goal of all teacher professional development is to improve student performance, but there is a substantial time lag between announcing an MSP grant program and the final analysis of data measuring student improvement. Even among partnerships funded in the first year, many are still working with their first cohorts of teachers. However, the initial data trends are promising.

The main lessons from the MSP program thus far are that it has succeeded in attracting substantial participation by science, mathematics, and engineering faculty, along with education faculty; it has generated widespread interest in participation; and it shows preliminary success in reaching the main goal of improved student performance. NSF’s track record shows it is the right place to house the proposed program to improve the education of new K-12 science and mathematics teachers.

Solving the attrition problem

The programs I have described for increasing the number of highly qualified science and mathematics teachers address the long-term problem of ensuring that the nation produces future generations of scientists, engineers, and technicians, as well as a citizenry equipped to function in a technologically advanced society. But there is also the problem of ensuring adequate numbers of graduates in science and technology (S&T) fields in the near term.

The legislation I plan to move through the Committee on Science and Technology in this Congress includes provisions aimed at improving undergraduate science, technology, engineering, and mathematics (STEM) education with the goal of attracting students to these fields and keeping them engaged. A serious problem with undergraduate STEM education is high student attrition. In most instances, attrition is not because of an inability to perform academically, but because of a loss of interest and enthusiasm.

This leak in the STEM education pipeline can be addressed in many ways. Certainly, increased attention by faculty to undergraduate teaching and the development of more effective teaching methods will help. In addition, there is a role for industry and federal labs to partner with universities for activities such as providing undergraduate research experiences, student mentoring, and summer internships.

The murky supply and demand picture

Although a well-educated S&T workforce of adequate size is generally regarded as an essential component of technological innovation and international economic competitiveness, there is disagreement and uncertainty about whether the current supply and demand for such workers is in balance and about the prospects for the future ability of the nation to meet its needs for such workers. The supply part of the equation centers on whether our education system is motivating and preparing a sufficient number of students to pursue training in these fields and whether the country will be able to continue to attract talented foreign students to fill openings in the S&T workforce, a third of which is currently made up of individuals from abroad. The demand side of the equation is clouded by increasing evidence that technical jobs are migrating from the United States.

In general, the migration of high-tech jobs mirrors what has happened in the manufacturing sector during the past 20 years. In the case of manufacturing, the decline in U.S.–based jobs has been attributed to lower production costs in low-wage countries, improved infrastructure in foreign countries, and the increased productivity of foreign workers. Now this same trend is encompassing high-tech jobs, which generally require a technical education, often for the very same reasons.

The overseas migration of manufacturing led to a deep restructuring of the hourly workforce: a switch to service jobs with generally lower wages and benefits and an increase in temporary workers. The trend for technical workers could result in similar dislocations of currently employed scientists and engineers and affect future employment opportunities. In addition, it is likely that current well-publicized trends will influence the career choices of students—a result that could accelerate the migration of jobs.

Some policy groups have advocated training more scientists and engineers to ensure that the nation can meet future demand and as a solution to the offshoring phenomenon. Advocates frequently cite increased graduation rates of scientists and engineers in China and India as one justification of this policy. Industry also frequently states that there is a shortage of trained scientists and engineers in the United States, forcing them to move jobs overseas that would otherwise remain here. In addition, these groups claim that we need to train more scientists and engineers to maintain U.S. technology leadership, which will result in greater domestic employment across the board. However, many professional societies and organizations (representing scientists and engineers) dispute these assessments.

Regardless of viewpoint, the most remarkable aspect of the debate about the supply and demand for S&T workers and the effects of offshoring is that the arguments are based on very little factual data. A recent RAND report, commissioned by the President’s Office of Science and Technology Policy, pointed out that the information available to policymakers, students, and professional workers is not adequate to make informed decisions either about policies for the S&T workforce or about individual career or training opportunities. The RAND study includes eight specific ways in which federal agencies can improve data collection in this area. Unfortunately, the Bush administration has not comprehensively enacted the RAND recommendations. A Government Accountability Office report also highlights the lack of data on the extent and policy consequences of offshoring.

At a roundtable discussion on June 23, 2005, the Democratic members of the Committee on Science and Technology attempted to frame what is known and not known about supply and demand for the U.S. S&T workforce; to delineate factors that influence supply and demand, including the offshoring of S&T jobs; and to explore policy options necessary to ensure the existence of an S&T workforce in the future that meets the needs of the nation. (The papers presented at the roundtable are available on the committee’s Web site.)

On the basis of available data on unemployment levels and inflation-adjusted salary trends of S&T workers, Michael Teitelbaum of the Alfred P. Sloan Foundation and Ron Hira of Rochester Institute of Technology concluded that no evidence exists for a shortage; in fact, the available data suggest that a surplus may exist. For example, Institute of Electrical and Electronics Engineers surveys of their membership show higher levels of unemployment during the past five years than for any similar time period during which such surveys have been conducted (starting in 1973) and also show salary declines in 2003 for the first time in 31 years of surveys. Teitelbaum indicated that there may well be exceptions in demand for some subfields that are not captured by available data, and Dave McCurdy, president of the Electronics Industries Alliance, said that it is necessary to look industry by industry in assessing the actual state of shortage or surplus.

Discussion of the effects of offshoring on the S&T workforce is constrained by the lack of reliable and complete data. However, the data that are available suggest that offshoring is growing and becoming significant. Hira compared data for major U.S. and Indian information technology (IT) services companies that showed significant differences for employee growth in 2004: up 45% for Wipro, up 43% for Infosys, and up 66% for Cognizant (three Indian companies) versus an 11% decline for Electronic Data Systems, no growth for Computer Sciences Corporation, and an 8% increase for Affiliated Computer Services (three U.S. companies).

Hira also described examples of high-level engineering design jobs moving offshore and provided anecdotal evidence that venture capitalists are beginning to pressure start-up companies to include offshoring in their business plans. As an indirect indicator of the increase in offshoring, Teitelbaum presented unpublished data from a study funded by the Sloan Foundation that showed substantial growth in Indian employment in software export companies (from 110,000 to 345,000 between 1999–2000 and 2004–2005) and in IT-enabled services companies (from 42,000 to 348,000 for the same interval).

The panelists agreed that the data available for characterizing the S&T workforce and for quantifying the impact of offshoring are inadequate. George Langford, the immediate past president of the National Science Board Committee on Education and Human Resources, noted the need for better information on science and engineering skill needs and on utilization of scientists and engineers. Both Hira and Teitelbaum suggested the need for government tracking of the volume and nature of jobs moving offshore, and particularly services jobs, for which little reliable data is available.

The policy recommendations from the roundtable fell into two areas. The first was that better data are needed to characterize the state of the S&T workforce and particularly to quantify the nature and extent of the migration of S&T jobs. This recommendation was shared by all the panelists.

The second set of recommendations focused on education and training. The thrust of these recommendations was that U.S. S&T workers will need to acquire skills that will differentiate them from their foreign competitors. This implies the need to identify the kinds of skills valued by industry and the need for much better information about the skill sets that industry can easily acquire abroad. This information should then inform the reformulation of science and engineering degree programs by institutions of higher education. In addition, the identification of skills requirements will allow the creation of effective retraining programs for S&T workers displaced by offshoring.

Finally, the panelists agreed that it is necessary to make careers in S&T more appealing to students. Specific recommendations included funding undergraduate scholarships and generous graduate fellowship programs and providing paid internships in industry.

There is much that the federal government, states, and the private sector can do in partnership to bring about the result we all seek: ensuring that the United States succeeds in the global economic competition. I believe that the Gathering Storm report provides an excellent blueprint for action. The question is simply this: Are we willing to invest in our children’s future? I know that I am not alone in answering “yes” to that question. We know what the problem is and we have solutions. What we need now is the will to stop talking and start taking substantive action.

From the Hill – Spring 2007

Bush 2008 budget: More bad news for R&D

On February 5, President Bush released his budget for fiscal year (FY) 2008, just as the new Democratic majority in Congress was racing to complete work on the FY 2007 budget. Although the president’s proposal contains more bleak news for most R&D agencies, the final FY 2007 budget contains a few pleasant surprises.

The president’s budget includes themes from previous budgets, with large proposed increases for the three physical sciences agencies in the president’s American Competitiveness Initiative (ACI), increases for weapons and human spacecraft development, and declining funding for the rest of the federal R&D portfolio.

Within an overall budget that once again proposes to restrain domestic spending but dramatically increase defense spending, many agencies, including the National Institutes of Health (NIH), would see their R&D funding fall. The overall federal investment in R&D would increase 1.4% to $143 billion, but development funding would take up the entire increase and more. The federal investment in basic and applied research would fall 2% as gains in funding for the ACI agencies would be more than offset by cuts in R&D funding for other agencies.

In broad terms, the president’s budget once again provides big increases in defense and homeland security, trims some entitlement programs, extends expiring tax cuts, and promises to reduce the budget deficit primarily by cutting domestic discretionary spending. For R&D, the budget offers a sustained commitment to increasing funding for the National Science Foundation (NSF), the Department of Energy (DOE) Office of Science, and the National Institute of Standards and Technology (NIST) laboratories in the Department of Commerce. These three research-oriented ACI agencies lead the pack in R&D gains, followed closely by proposed gains for development programs in the National Aeronautics and Space Administration (NASA) and the Department of Defense (DOD). But within a declining domestic budget, there would be stark contrasts between these priority programs and everything else: Nearly all other nondefense R&D programs would face cuts, and defense research would also fall steeply.

The FY 2007 budget, which was approved by Congress on February 14 and signed by the president the next day, includes the following good news: increases for the three key physical sciences agencies (NSF, DOE, and NIST), an inflation-indexed increase instead of proposed flat funding for NIH, and a dramatic rise in energy R&D funding. In addition, several R&D programs that had been operating at reduced funding levels would see their budgets boosted back to last year’s levels. In addition, the spending bill is unusual in that it contains no congressionally designated earmarks, which in some cases results in large increases for core R&D programs within flat or declining overall budgets.

The completed 2007 budget brings the total federal R&D investment to $139.9 billion, an increase of 3.4%. However, the entire increase would go to development programs in DOD for weapons systems and NASA for a new human spacecraft. The federal investment in basic and applied research would barely stay even with last year at $56.8 billion (up 0.2%), narrowly avoiding the first cut in federal research in at least 30 years, with increases for research funded by the three ACI agencies and NIH offset by steep cuts in NASA, the Department of Homeland Security (DHS), and other agencies’ research portfolios. In inflation-adjusted terms, the federal research portfolio would decline for the third year.

R&D in the FY 2008 Budget by Agency
(budget authority in millions of dollars)

  FY 2006 FY 2007 FY 2008 Change FY 07-08
Actual Estimate Budget Amount Percent
Total R&D (Conduct and Facilities)
Defense (military) ** 74,289 78,231 78,996 765 1.0%
S&T (6.1-6.3 + medical) ** 13,838 13,677 10,930 -2,747 -20.1%
All Other DOD R&D ** 60,451 64,554 68,066 3,512 5.4%
Health and Human Services 28,990 29,650 29,364 -286 -1.0%
Nat’l Institutes of Health 27,760 28,405 28,080 -325 -1.1%
All Other HHS R&D 1,230 1,245 1,284 39 3.1%
NASA 11,295 11,698 12,593 896 7.7%
Energy 8,556 8,744 9,224 480 5.5%
Atomic Energy Defense R&D 4,072 3,789 3,845 56 1.5%
Office of Science 3,326 3,515 4,072 557 15.8%
Energy R&D 1,158 1,440 1,307 -133 -9.2%
Nat’l Science Foundation 4,183 4,482 4,856 374 8.3%
Agriculture 2,438 2,255 2,010 -245 -10.8%
Commerce 1,086 1,091 1,088 -3 -0.3%
NOAA 624 601 544 -57 -9.5%
NIST 437 465 515 50 10.8%
Interior 639 636 621 -15 -2.4%
U.S.Geological Survey 561 566 547 -19 -3.4%
Transportation 820 796 812 16 2.0%
Environ. Protection Agency 622 567 547 -20 -3.5%
Veterans Affairs 824 818 822 4 0.5%
Education 323 318 317 -1 -0.3%
Homeland Security 1,406 948 933 -15 -1.6%
All Other 765 760 782 22 2.9%


Total R&D 136,236 140,993 142,966 1,973 1.4%
Defense R&D 78,737 82,316 83,016 700 0.9%
Nondefense R&D 57,498 58,677 59,949 1,272 2.2%
Nondefense R&D excluding NASA 46,204 46,979 47,356 376 0.8%
Basic Research 27,489 28,217 28,346 129 0.5%
Applied Research 28,398 28,317 27,081 -1,236 -4.4%


Total Research 55,887 56,533 55,426 -1,107 -2.0%
Development 75,999 80,356 82,774 2,418 3.0%
R&D Facilities and Equipment 4,350 4,104 4,765 662 16.1%

Source: AAAS, based on OMB data for R&D for FY 2008, agency budget justifications, and information from agency budget offices.

Note: The projected inflation rate between FY 2007 and FY 2008 is 2.4 percent.

* FY 2007 figures reflect AAAS estimates of pending FY 2007 appropriations (H.J. Res. 20).

** FY 2007 and 2008 figures include requested supplementals.

Preliminary February 7, 2007 – will be revised

New Democratic leaders call for tough climate-change legislation

The new Democratic leaders in Congress, House Speaker Nancy Pelosi (DCA) and Senate Majority Leader Harry Reid (D-NV), have pledged to pursue tough legislation to deal with climate change. Already, four bills have been introduced in the Senate that would impose mandatory greenhouse gas emission limits.

Pelosi also announced the creation of a Select Committee on Energy Independence and Global Warming, to be chaired by Rep. Ed Markey (D-MA). Although it will not have legislative authority and will expire at the end of the current Congress, the committee will likely put pressure on the House Energy and Commerce Committee, whose chairman, John Dingell (D-MI), was not pleased with the news, stating, “These kinds of committees are as useful and relevant as feathers on a fish.” Dingell, who has previously opposed mandatory action to address climate change, had already announced climate change as a priority for the committee and his intention to invite former Vice President Al Gore and California Governor Arnold Schwarzenegger to testify at a hearing that would feature “broadly divergent views as to what should be done on climate change.”

Leaders of the House Science and Technology Committee and Committee on Oversight and Government Reform have also listed climate change among their priority topics.

In the Senate, where five bills or possible bills have already been introduced and more are being discussed, the Environment and Public Works Committee will have lead jurisdiction. Chairwoman Barbara Boxer (D-CA) has restructured the committee to include two new subcommittees on global warming. Boxer will chair the Public Sector Solutions to Global Warming, Oversight, Children’s Health Protection and Nuclear Safety Subcommittee on which Senator Lamar Alexander (R-TN) will be the Ranking Member. Senator Joseph Lieberman (I-CT) will chair the Private Sector and Consumer Solutions to Global Warming and Wildlife Protection Subcommittee, with Senator John Warner (R-VA) serving as Ranking Member.

Although Senate Energy and Natural Resources Committee Chairman Jeff Bingaman (D-NM) recently ceded jurisdiction on climate change, he is drafting a climate change bill and his committee held a standing-room-only hearing on the topic on January 24.

The Foreign Relations Committee has also weighed in, with Chairman Joseph Biden (D-DE) and Ranking Member Richard Lugar (R-IN) reintroducing a “Sense of the Senate” resolution that calls for the United States to return to international climate negotiations and stipulates that all major emitters of greenhouse gases, including developing countries such as China and India, participate as well. A similar resolution passed the committee last year but stalled on the floor.

The five Senate proposals call for varying levels of emissions reductions and would all use a cap-and-trade system as the mechanism for limiting greenhouse gas emissions.

On January 12, Senators McCain (R-AZ) and Lieberman (I-CT), introduced S. 280, the Climate Stewardship and Innovation Act of 2007, with Sens. Barack Obama (D-IL) and Hilary Clinton (D-NY) joining as cosponsors. Their plan would cap emissions at 2004 levels in 2012 and decrease those limits to 1990 levels by 2020. It would eventually cut U.S. emissions to one-third the amount they were in 2000 by 2050. These limits are different from previous bills introduced by McCain and Lieberman, reflecting both the growth in emissions in recent years and the growing sentiment in favor of first slowing the growth of emissions before seeking steep reductions. The bill also contains additional credits for “offsets,” actions to reduce greenhouse gas emissions taken by those outside the cap-and-trade system, as well as incentives for the use of nuclear energy. The bill would invest money raised by the auction of allowances to deploy advanced technologies and practices for reducing greenhouse gas emissions and to ameliorate the negative effects of any unavoidable global warming on low-income Americans and populations abroad.

A similar bill has been introduced in the House by Reps. John Olver (DMA) and Wayne Gilchrest (R-MD). Although considered a companion bill, the legislation is somewhat more aggressive on emissions cuts and somewhat less supportive of new technology.

Bingaman’s draft bill, which has picked up the support of Senator Arlen Specter (R-PA), focuses on reducing energy intensity, a ratio of greenhouse gas emissions per unit of economic output, usually measured in gross domestic product (GDP). The bill would cap intensity at 2013 levels by 2020 and then reduce it 2.6% annually between 2012 and 2021 and 3% a year after that. Like the McCain-Lieberman bill, the Bingaman bill would provide credits for offsets. Bingaman has included a “safety valve” that initially limits to $7 per ton the amount that industry would have to pay for exceeding emission limits, with that figure rising annually by 5% above the projected inflation rate. Many business leaders, including some of those in the newly formed environmentalist/industry United States Climate Action Partner-ship, favor the inclusion of a safety valve. Proceeds from the auction of permits would be used for low-carbon energy research, development, and deployment.

On January 11, the Energy Information Administration (EIA) released an analysis of a similar proposal by Bingaman, finding that it would cost 0.1% of GDP through 2030. Bingaman has hailed this finding as proof that a climate change program can work without causing damage to the economy. According to EIA, Bingaman’s plan would, compared to business as usual, lower emissions by 5% (372 million tons) in 2015, 11% (909 million tons) in 2025, and 14% (1,259 million tons) by 2030; however, the actual level of emissions would still be higher than today.

Boxer and Sen. Bernie Sanders (I-VT) introduced the Global Warming Pollution Reduction Act of 2007 (S. 309), which would reduce greenhouse gas emissions to 1990 levels by 2020 and to 80% below 1990 levels by 2050. Additional reductions are allowed if certain temperature or greenhouse gas concentration thresholds are crossed. The bill also contains energy efficiency and renewable energy portfolio standards. The bill, which contains the largest cuts in emissions of all the bills introduced, has the backing of the environmental community, based on the exclusion of nuclear energy provisions and its large-scale emissions reductions, but no Republican cosponsors as of yet.

Sen. Dianne Feinstein (D-CA) and Sen. Thomas Carper (D-DE) introduced The Electric Utility Cap-and-Trade Act (S. 317), which focuses on reducing emissions in the electricity sector. The measure would cap greenhouse gas emissions at 2006 levels by 2011 and at 2001 levels in 2015, with continued reductions so that emissions are 25% below projected levels in 2020. The bill has been endorsed by six large utilities, none of which rely predominantly on coal. The bill would use money from auctioning credits for low-carbon technology and helping low-income communities and ecosystems adapt to climate change.

On February 2, Senators Olympia Snowe (R-ME) and John Kerry (DMA) introduced S. 485, The Global Warming Reduction Act of 2007, which would amend the Clean Air Act to address climate change. It would freeze U.S. emissions in 2010 and use an economy-wide cap-and-trade system to reduce them so that they are 65% below 2000 emissions levels by 2050. The bill includes measures to advance technology and reduce emissions through clean, renewable energy and energy efficiency in the transportation, industrial, and residential sectors and requires the United States to derive 20% of its electricity from renewable sources by 2020. It calls for National Research Council studies every two years on the probability of avoiding dangerous anthropogenic interference with the climate system and the progress made by the United States as of the date of the report to avoid that interference. It also would establish a National Climate Change Vulnerability and Resilience Program to evaluate and make recommendations about local, regional, and national vulnerability and resilience to impacts relating to longer-term climatic changes and shorter-term climatic variations, including changes and variations resulting from human activities.

House passes stem cell bill as part of first 100 hours agenda

On January 11, the House passed H.R. 3, the Stem Cell Research Enhancement Act, which would expand researcher access to embryonic stem cell lines. The bill, sponsored by Reps. Diana DeGette (D-CO) and Mike Castle (R-DE), was identical to last year’s H.R. 810, the first bill that President Bush vetoed during his presidency. The current bill has continued to garner bipartisan support. The 253-174 tally had 15 more yes votes than last year’s bill. With another Bush veto imminent, however, the House is still 37 votes shy of the two-thirds majority necessary to override.

H.R. 3 was part of the Democrats’ “100 Hours Agenda,” which also included implementing various 9/11 Commission recommendations, increasing the minimum wage, and mandating that the federal government negotiate with companies for lower-cost prescription drugs. Even with the prospect of another presidential veto, the Democrats included the stem cell bill on its agenda to emphasize the growing public support for stem cell research. Recent polls by the Civil Society Institute among others indicate that the majority of Americans support federal funding for embryonic stem cell research.

A companion bill has been introduced in the Senate.

Other bills to watch on the health front include the Genetic Information Nondiscrimination Act (H.R. 493), which would bar employers and health insurers from discriminating against people on the basis of genetic information. Previously, the bill passed the Senate but stalled in the House. The bill has been introduced in the House with a bipartisan group of 143 cosponsors and is expected to pass easily. Bush has already pledged to sign the bill.

Democrats to press competitiveness legislation

Democrats have signaled that they will push for new legislation to bolster U.S. economic competitiveness and innovation, with improvements to education at the heart of their approach. During the Democratic leaders’ January 19 State of the Union address, Speaker Nancy Pelosi discussed in particular the importance of science education, stating that “innovation and economic growth begins in America’s classrooms. To create a new generation of innovators, we must fund No Child Left Behind so that we can encourage science and math education, taught by the most qualified and effective teachers.”

Rep. Bart Gordon (D-TN), chair of the renamed House Committee on Science and Technology, listed innovation at the top of his list of priorities and renamed one of the subcommittees Technology and Innovation as a reflection of its importance. Gordon introduced the 10,000 Teachers, 10 Million Minds Science and Math Scholarship Act (H.R. 362) and Sowing the Seeds through Science and Engineering Research Act (H.R. 363), versions of which passed the Science Committee last year but did not make it to the House floor.

The Sowing the Seeds bill would authorize a 10% funding increase for basic research in the physical sciences at the National Science Foundation (NSF), the National Institute of Science and Technology (NIST), the Department of Energy (DOE), the National Aeronautics and Space Administration (NASA), and the Department of Defense. It would also authorize a NSF and DOE grant program for earlycareer researchers and establish a national coordination office under the White House Office of Science and Technology Policy to prioritize university and national research infrastructure needs.

The 10,000 Teachers, 10 Million Minds bill reflects Gordon’s belief that building on existing programs is more effective than creating new programs. The bill would expand NSF’s Robert Democrats to press competitiveness legislation Noyce Scholarship program, which provides scholarships to science, technology, engineering, and math (STEM) majors who commit to teaching science or math at elementary and secondary schools. It also authorizes summer teacher training institutes at NSF and DOE; prioritizes teacher training within NSF’s Math and Science Partnership program; and amends NSF’s STEM Talent Expansion program to improve undergraduate STEM education.

Rep.Vernon Ehlers (R-MI) has also introduced a package of four bills (H.R. 35, 36, 37, and 38) to address science and math education. The bills would amend No Child Left Behind to require that states’ accountability metrics, which currently focus on reading and math, also include the results of the science assessments. The bills would also create tax credits for science and math teachers as well as for businesses that donate new equipment or teacher training to schools and enhance science and math readiness for children in the Head Start program.

Fisheries, bioterrorism bills approved

Just before adjournment in December, the 109th Congress approved a variety of legislation, which has been signed by President Bush, including bills that strengthen fisheries protection and create a new bioterrorism agency.

In reauthorizing the Magnuson- Stevens fisheries law, Congress strengthened the role of science in fisheries management by requiring that catch limits be based on the recommendations of the science and statistical committees of the regional fishery management councils. The bill does not specify penalties for fisheries that exceed their catch; instead, it directs the regional councils to establish accountability measures. It mandates an end to overfishing in fisheries with depleted stocks within two and a half years.

The bill also establishes a mechanism that allows the selling and trading of shares in a fishery through “limited access privilege programs.” This type of market-based cap-and-trade program has been used successfully in other environmental arenas as a costeffective way to implement limits.

Although environmental groups were concerned about the bill’s weak accountability measures, most agreed that the bill as a whole will strengthen Fisheries, bioterrorism bills approved fisheries protection.

Congress also approved the Pandemic and All-Hazards Preparedness Act, which creates a $1 billion agency for bioterrorism research called the Biomedical Advanced Research and Development Authority (BARDA). The legislation is aimed at strengthening the effectiveness of two-year-old Project Bioshield, which was designed to encourage drug companies to create new medicines for infectious diseases. BARDA will be housed in the Department of Health and Human Services and will manage the administration’s efforts to combat bioterrorism threats.


“From the Hill” is prepared by the Center for Science, Technology, and Congress at the American Association for the Advancement of Science (www.aaas.org/spp) in Washington, D.C., and is based on articles from the center’s bulletin Science & Technology in Congress.

Science’s Social Effects

In 2001, the National Science Foundation (NSF) told scientists that if their grant proposals failed to address the connection between their research and its broader effects on society, the proposals would be returned without review. The response was a resounding “Huh?”

It’s time we faced facts. Scientists and federal funding agencies have failed to respond adequately to a reasonable demand from Congress and the public. The demand: Researchers and their tax-supported underwriters must take a comprehensive look at the broader implications of their science in making decisions about what research to support.

There are exceptions, but scientists and engineers generally have had a difficult time meeting this merit review criterion. Yes, the quantity of responses to what is called the “broader impacts criterion” has risen steadily. But the quality of those responses remains a persistent problem. In order to improve the quality, we need a more interdisciplinary approach to generating and reviewing grant proposals.

In theory, it might be reasonable to think this problem could be addressed by teaching scientists and engineers how to assess the broader effects of their research. In practice, however, such attempts have led to the widespread view that intellectual merit is the primary and scientific criterion, and that broader impacts is a secondary and minor “education” criterion. Too often, the responsibility for satisfying the broader impacts criterion has been taken over by education and public outreach (EPO) professionals. They are hired to facilitate education activities for scientists, who are trained chiefly in science, not in education.

This approach allows scientists to conduct their research on their own while the EPO professionals take care of education and outreach. But it reinforces the idea that research in science and engineering is separate from education in science and engineering; an idea that runs counter to one of the main motivations behind the broader impacts criterion, which is that scientific research and education can and should be integrated.

To our knowledge, all NSF-sponsored workshops in 2005 and 2006 that offered advice to scientists on how to address the broader impacts criterion focused on broader effects only in terms of education and outreach. The danger inherent in this approach is that education and outreach are liable to emphasize a triumphalist view, highlighting only the striking advances of science and technology. This approach does not reflect on the larger moral, political, and policy implications of the advance of scientific knowledge and technological capabilities. Granted, education and public outreach are important elements of the broader impacts criterion. But without equal consideration of the ethical, political, and cultural elements of science, the focus on education and outreach threatens not only to absolve scientists and engineers of the responsibility to integrate their research and education activities, but also to turn the broader impacts criterion into an advertisement for science and technology.

One can hardly blame EPO professionals for marketing themselves as experts who can help with issues of broader effects. Unfortunately, however, EPO professionals have now come to be viewed as the group uniquely qualified to help scientists confused about how to satisfy the broader impacts criterion. EPO activities focus on issues such as expanding the participation of underrepresented groups (for example, by facilitating campus visits and presentations at institutions that serve those groups), enhancing research and education infrastructure (for example, by contributing to the development of a digital library), disseminating research more widely (for example, by developing a partnership with a museum or a science and nature center to develop an exhibit), and benefiting society (for example, by interpreting the results of specialized scientific research in formats understandable for nonscientists).

It is simply a misinterpretation of the broader impacts criterion to label it the education criterion. It would make more sense to place science in its larger societal context. Take, as just one example, the goal of increasing the participation of underrepresented groups. That goal is not fulfilled solely by giving presentations at minority-serving institutions or by including a woman or minority group member on the research team. It should also involve giving some thought to why diversity is important to scientific research (for example, by exploring Philip Kitcher’s ideal of well-ordered science or David Guston’s calls for the democratization of science). The danger is that without such reflection the goal of increasing minority representation will simply appear as another case of identity politics.

It is, of course, true that scientists simply don’t have time to read philosophy or studies of science. But they don’t have time for reading educational theory either, yet sensitivity to questions of teaching remains part of the science portfolio. The same should be true of the ethical and policy implications of their work.

EPO professionals have taken it upon themselves to engage scientists on the level of science’s broader educational effects. We applaud this as long as scientists and engineers participate in EPO activities rather than treat EPO professionals as separate subcontractors. Instead of allowing EPO professionals to shoulder the sole burden of articulating science and technology’s broader effects, more of us ought to share the load. Integrating research and education is a worthy ideal that NSF is concerned to promote, but it hardly exhausts the possibilities inherent in the broader impacts criterion, which encompasses issues such as the democratization of science, science for policy, interdisciplinarity, and issues of ethics and values.

The challenge facing NSF, and the scientific and technical communities generally, is that disciplinary standards of excellence alone no longer provide sufficient warrant for the funding of scientific research. Put differently, Vannevar Bush’s 1945 model for science policy has broken down at two crucial points. First, it is no longer accepted that scientific progress automatically leads to societal progress. As long as this belief was the norm, disciplinary standards within geophysics or biochemistry were sufficient for judging proposals, and the wall separating science from society could remain intact. Second, and following from the first, recognition of the inherently political nature of science has become an accepted part of the landscape. But the point is not that science is subjective; science and engineering daily demonstrate their firm grasp on reality, even if the old dream of scientific certainty has faded, at least for the scientifically literate. No, the point is that science is deeply and inescapably woven into our personal and public lives, from the writing of requests for proposals to decisions made at the lab bench to the advising of congressional committees.

Unlike EPO professionals, researchers on science—historians and philosophers of science, policy scientists, and researchers in science, technology, and society studies— have generally failed to recognize the broader impacts criterion as an opportunity. We have built careers by reflecting on the broader effects of science and technology, but we have offered little help to scientists and engineers perplexed by the demand to assess and articulate those broader effects. Humanists and social scientists who conduct research on science, especially research on the relationship between science and society, should seize the opportunity the broader impacts criterion presents. We should work with scientists to help them reflect on and articulate the broader effects of their research. We should follow the example of EPO professionals, becoming facilitators in the assessment of the effects of research. But we should do so by instilling a critical spirit of reflection in scientists and engineers.

For their part, scientists should embrace, not merely meet (or even attempt to avoid) the broader impacts criterion. We philosophers believe that publicly funded scientists have a moral and political obligation to consider the broader effects of their research. To paraphrase Socrates, unexamined research is not worth funding. But if calls to duty sound too preachy, we can also appeal to enlightened self-interest. Agency officials, from the NSF director on down, are constantly asked to explain the results of the funding NSF receives and distributes. A fresh set of well-thought-out accounts of the broader effects of last year’s funded research is likely to play better on Capitol Hill than traditional pronouncements about how investments in science drive the economy and are therefore necessary to insure the U.S. competitiveness.

Sadly, there is little evidence that proposals deemed strong in terms of the broader impacts criteria find themselves at any significant advantage over proposals that are weak on those topics. Often, the criterion is used as a sort of tiebreaker in cases in which reviewers must decide between proposals of otherwise equal intellectual merit. Although in principle, there isn’t a problem with occasionally using this approach, tiebreaking is not the criterion’s only function.

WE PHILOSOPHERS BELIEVE THAT PUBLICLY FUNDED SCIENTISTS HAVE A MORAL AND POLITICAL OBLIGATION TO CONSIDER THE BROADER EFFECTS OF THEIR RESEARCH. TO PARAPHRASE SOCRATES, UNEXAMINED RESEARCH IS NOT WORTH FUNDING.

To encourage scientists and engineers to use the broader impacts criterion to its fullest, NSF should include an EPO professional and a researcher on science both as individual reviewers of proposals and as members of review panels. Such an approach—particularly in the review panels, in which researchers from different disciplines interact with each other—will encourage all reviewers to be more responsive to the broader impacts criterion. This, in turn, will encourage scientists and engineers to be more concerned with the broader effects of their research. Scientists and engineers will be motivated to seek out both EPO professionals and researchers on science to work together on grant proposals. The result? The kind of integrated and interdisciplinary research NSF seeks to support.

Scientists may view these suggestions as attempts at politicizing the (ideally) value-neutral pursuit of science. We suspect that such a reaction may underlie many scientific and technical researchers’ resistance to the criterion, as if assessing and articulating the broader effects of scientific and technical research were somehow outside science and engineering. It’s as if the criterion somehow represents outside interference in science.

We also suspect that one reason EPO professionals have been so successful in engaging scientists and engineers on broader effects is the widely shared view among scientists that any resistance on the part of the public to the advancement of science and technology is simply due to lack of science education. The public certainly ought to know more about science and technology, but there is little evidence that universalizing scientific and technological literacy would by itself produce a wholly supportive public.

If society needs to be educated about science and technology (and it does) scientists and engineers, too, need to be educated about the effect of science and technology on society, as well as the effect of society on science and technology. The broader impacts criterion represents an excellent (perhaps the best) opportunity for scientists, engineers, researchers on science and technology, policymakers, and members of the larger society to engage in mutual education. This promise will be fulfilled only if scientists, engineers, EPO professionals, and researchers on science work together and use the criterion to the fullest.

Finally, concern with the criterion should go beyond helping NSF improve its merit review process, and even beyond helping NSF achieve its larger goals of integration and interdisciplinarity. Insofar as science and technology have effects on our society, asking scientists and engineers to consider and account for those broader effects before they commit themselves to a particular research program, and before taxpayers commit to funding that program, sounds eminently reasonable. This is not to suggest that members of the public should have the final say on every funding proposal. It is to suggest, however, that publicly funded science should not always be judged only on its scientific merit by scientists. We need to explore the possibility of a new ideal of impure science, in which scientists and engineers both educate and learn from others about the relation between science and society.

Emerging Economies Coming on Strong

The Council on Competitiveness released its flagship publication, Competitiveness Index: Where America Stands, last November. While the United States remains the global economic leader, the Index makes the case that its position is not guaranteed. The data and our analysis clearly point to a changing global environment, confirming the need to revisit how the United States will sustain its past position of economic strength and dominance under these new circumstances. The growth of emerging economies will reduce the U.S. share of the global economy, but it is unclear exactly how this will affect U.S. prosperity.

THE GLOBAL ECONOMIC LANDSCAPE IS CHANGING DRAMATICALLY, BUT THE UNITED STATES CAN CONTINUE TO PROSPER AS LONG AS IT CAPITALIZES ON ITS STRENGTH IN DIVERSITY AND CREATIVITY.

Two issues in particular must factor into the calculus as we proceed:

Knowledge is becoming an increasingly important driver of value in the global economy. A larger share of trade is also captured by services, and a larger share of assets and investments is intangible. This shift to services, high-value manufacturing, and intangibles creates more opportunities for the United States with its traditionally strong position in knowledge-driven activities and an already high stock of tangible as well as intangible assets.

Multinational companies are evolving into complex global enterprises, spreading their activities across value chains over different locations to take advantage of regional conditions and competencies. This process creates more competition as regions now must prove their competitiveness in order to attract and retain companies and investments. For the United States, it begs a fundamental rethinking of how states and localities strategize and execute economic development activities.

The United States will almost inevitably be a smaller part of a growing world economy due to the structural changes under way across the globe. However, there is no reason why the United States cannot retain its position as the most productive and prosperous country in the world.

The coming economy will favor nations that reach globally for markets, and those who embrace different cultures and absorb their diversity of ideas into the innovation process. It will be fueled by the fusion of different technical and creative fields, and thrive on scholarship, creativity, artistry, and leading-edge thinking. These concepts are U.S. strengths. These concepts are the nation’s competitive advantage. These concepts are uniquely American—for now.

Growing share of the global economy

In the past five years, China, India, and Russia, together with other fast-growing economies mostly in Asia and Latin America, have averaged almost 7% growth compared with 2.3% in rich economies. According to Goldman Sachs, by 2039, Russia, India, China, and Brazil together could be larger than the combined economies of the United States, Japan, the United Kingdom, Germany, France, and Italy. China alone could be the world’s second-largest economy by 2016 and could surpass the United States by 2041.

Emerging Economies’ Share of Key Indicators

Source:World Bank, UNCTAD, U.S.Department of Energy, EIA

Most populous and still growing

Fast-growing populations and economies are translating into a large worldwide increase in middle-income consumers. While industrialized countries will add 100 million more middle- income consumers by 2020, according to projections by A.T. Kearney, the developing world will add more than 900 million, and China alone will add 572 million.

Population and projected growth

Source: U.S. Census

Large professional workforce

In a sample of 28 low-wage countries, the McKinsey Global Institute found about 33 million “young professionals” (university graduates with up to seven years experience), compared to 18 million in a sample of eight high-wage countries, including 7.7 million in the United States. However, McKinsey found that only 2.8 million to 3.9 million of the 33 million in low-wage countries had all the skills necessary to work at a multinational corporation, compared to 8.8 million in high-wage countries.

Young Professionals, 2003 (Thousands)

Source:McKinsey Global Institute, The Emerging Global Labor Market: Part IIÑ The Supply of Offshore Talent in Services (June 2005)

Technology export leaders

Foreign multinationals have played a critical role in the development of advanced technology capabilities in emerging economies. For example, 90% of China’s information technology exports come from foreignowned factories. The United States, still the world’s largest overall producer of advanced technology, now has a trade deficit in this area, in part because U.S. technology firms have expanded production globally to meet both foreign and domestic demand.

Top Ten High-Tech Exporters (1986), Billions of 1997 U.S. Dollars

Source: Global Insight, Inc.

U.S. foreign operations outpace exports

Despite their global expansion, the activities of U.S. multinationals are still overwhelmingly based in the United States. The U.S. share of their total employment, investment, and production has changed relatively little even as globalization has accelerated. The primary motivation for moving production offshore is to search for new customers. Overall, 65% of U.S. foreign affiliate sales are to the local market, 24% to other countries, and only 11% are exported back to the United States. Foreign multinationals have played a critical role in the development of advanced technology capabilities in emerging economies. For example, 90% of China’s information technology exports come from foreign-owned factories. The United States, still the world’s largest overall producer of advanced technology, now has a trade deficit in this area, in part because U.S. technology firms have expanded production globally to meet foreign and domestic demand.

Sales Volumes of U.S. Multinationals

Source: U.S. Bureau of Economic Analysis

Steady increase of offshore investments

For decades, multinational corporations have set up foreign subsidiaries to perform manufacturing and assembly for overseas markets. In recent years, this model has evolved, as companies have developed global infrastructures that allow them to locate other business activities—from customer services and computer programming to R&D—nearly anywhere in the world.

Percentage of U.S. Corporate Investment Spent Offshore

Source: A.T. Kearney, Foreign Direct Investment Confidence Index (2005)

India’s Growth Path: Steady but not Straight

By almost any reckoning, the Indian economy is booming. This year, Indian officials revised their estimated economic growth for 2006 from 8% to 9.3%. This growth has been sustained over the past several years, effectively doubling India’s income every eight to nine years.

Since 1991, the year India removed some of the most crippling controls ever imposed on business activities in a non-communist country, it has not only been attracting large amounts of foreign investment, it has also begun luring back many skilled Indians who had chosen to live overseas. It has also lifted millions of Indians out of poverty.

Such a scenario seemed impossible to conceive in 1991, when the Indian economy was on the ropes, as its foreign reserves plummeted to a level that would cover only three weeks of imports and the main market of its exports (the Soviet Union, and by extension, the eastern bloc) unravelled. Forced to make structural adjustments to its economy, India lifted many restrictions on economic activity, as a result of which macroeconomic indicators have improved vastly (Table 1). Foreign investors, once shy, have returned.

The gross domestic product grew at a compounded rate of 9.63% annually during this period, and capital inflows increased dramatically. This change is remarkable because since India’s independence in 1947, it had pursued semi-autarkic policies of self-sufficiency and self-reliance, placing hurdles and barriers in the path of foreign and domestic businesses. Foreign investors shunned India because they were not welcome there. Restrictions kept multinational firms out of many areas of economic activity, and once in, companies were prevented from increasing their investments in existing operations. In 1978, the government asked certain multinationals to dilute their equity to 40% of the floating stock or to divest. IBM and Coca Cola chose to leave India rather than comply. Six years later, a massive explosion at a Union Carbide chemical plant in Bhopal, which killed more than 2,000 people within hours of the gas leak, brought India’s relations with foreign investors to its nadir.

TABLE 1
Capital Flows in India

  U.S. $ (billions)   Percent of GDP
1992-93 2004-05 % Growth 1992-93 2004-05
Net capital flows 5.16 31.03 16.1 2.40 4.79
Official flows 1.85 1.51 -1.9 0.88 0.23
Debt 2.38 12.71 15.0 1.11 1.96
FDI 0.32 5.59 27.1 0.15 0.86
Portfolio equity 0.24 8.91 35.1 0.11 1.37
Miscellaneous -0.98 3.90 -0.45 0.60
Current account 59.93 313.41 14.8 27.86 48.34
Capital account 36.67 158.30 13.0 17.05 24.42

The biggest change in 1991 was that India stopped micromanaging its economy by instituting policies:

  • Allowing foreign firms to own a majority stake in subsidiaries;
  • Liberalizing its trading regime by reducing tariffs, particularly on capital goods;
  • Making it easier for businesses to take money in and out of India;
  • Lifting limits on Indian companies to raise capital, to close business units that were no longer profitable, and to expand operations without seeking approval from New Delhi; and,
  • Complying with the World Trade Organization (WTO), after considerable internal debate and opposition, by strengthening its patent laws.

This last measure is a brave one, because there is a considerable body of Indian opinion, ranging from anti-globalization activists to open source enthusiasts, aligned against strengthening the patent regime. India has had an ambivalent relationship with the idea of property and private ownership: Squatting on somebody else’s property is not unusual; Indians copy processes and products, not always successfully; they resent multinationals exercising intellectual property rights; they protest when foreign firms establish such rights over products or processes Indians consider to be in public domain; and India has one of the world’s most enthusiastic communities of software developers who prefer the open-source model.

After passing legislation confirming India’s compliance with the WTO intellectual property rights regime, government officials now hope that many more companies will join the 150 multinational companies, including GE and Microsoft, that have set up research and development (R&D) labs in India to tap into the country’s talent pool of engineers. But its legislative will is already under challenge. The Swiss pharmaceutical company Novartis, which makes an anti-leukemia drug called Gleevac specifically targeting a particular form of cancer, has tested the new law, by seeking to overturn a local ruling that would have prevented Novartis from extending its patent over Gleevac, at a time when Indian generic drug makers want to enter the market. The new Indian law allows patents to be granted on new versions of older medicines, provided the company can show that the new version is a significant improvement on the original version. Health activists say millions of lives are at stake; Novartis says only about 7,500 people in India are affected by this form of cancer, and 90% of them receive the medicine for free, as part of the firm’s philanthropic activities. The case, which is being heard in an Indian court, will be a measure of India’s determination to continue opening its economy.

Because of its well-founded concern with providing millions of poor people with affordable medicine, India has for years maintained a drug price-control order, which restricted the prices companies could charge for pharmaceuticals. In addition, its patent policies prevented multinationals from patenting products; they could only patent processes. Indian generic drug manufacturers could circumvent patenting processes, which meant an Indian company could manufacture a copycat drug, with virtually no development costs, simply by finding an alternative process for producing the drug. That is changing now, and with interesting consequences.

Today, most sectors of the Indian economy are open for foreign investment (Table 2). As a result, foreign investment has increased across the board, with electrical products, electronics products, and telecommunication sectors being the main beneficiaries of the new regime (Table 3). To be sure, these figures appear small compared to the amount of foreign investment India’s immediate rival China attracts yearly. But domestic capital formation is high in India, making India less reliant on foreign investment than is China, and Indian governments have had to do with a fractious opposition, which has vocally opposed liberalization.

Indeed, the past 15 years haven’t been politically easy. The kind of stories for which India routinely attracts headlines—terrorist attacks, religious strife, caste-based violence, natural disasters, the nuclear standoff with neighboring Pakistan, violence by movements seeking greater autonomy, if not outright independence—have continued to appear with unfailing regularity. On top of that, India has had five parliamentary elections in this period, yielding five different prime ministers leading outwardly unstable coalitions. And yet, the economy has continued to grow, as if on auto-pilot, ignoring these distractions.

Annual economic growth of 8% means that India adds the equivalent of the national income of a medium-sized European economy to itself every year. In theory, it means giving every Indian $200 a year in a country where one in four Indians continues to earn less than a dollar a day. This has raised millions out of poverty, spread stock ownership among the middle class, and made billionaires out of some Indians. There are now more than two dozen Indians on the list of the world’s wealthiest individuals published by Forbes magazine, and you find them increasingly at the World Economic Forum at Davos.

Indeed, for the past several years, India has been the talk of the town at Davos. Whether among delegates or among speakers on various panels, Indians are ubiquitous. India has used this visibility to distinguish itself from China by emphasizing its pluralist democracy as much as its high-growth potential. At the Zurich airport where most Davos delegates arrive, India has posters advertising itself as “the world’s fastest-growing free market democracy.” This growth momentum is remarkable because for a long time, the economy grew at what the economist Raj Krishna derisively called “the Hindu rate of growth” of some3% per year.

The un-China

In many ways India is emerging as a major counterpoint to China. To be sure, China is far ahead of India in having built much superior infrastructure. It attracts multiples more of dollars in foreign investment and dominates global trade. China is extending its railway lines to remote parts of its western region, and today there are more skyscrapers in Shanghai than in Manhattan. But while China is building from scratch, India is fixing and tinkering with its creaking infrastructure. China had few railway lines to start with when the Communists assumed power in 1949; India had the world’s largest rail network at Independence in 1947. In keeping with its revolutionary ethos, China eliminated its entrepreneurs, sending them into exile or labor camps; socialist India permitted them to operate, keeping them hidden from public view as though they were the family’s black sheep.

TABLE 2
Foreign Investment Limit in Indian

Companies by Sector

Permitted Equity Sector
0 RETAIL TRADING, REAL ESTATE BELOW 25 ACRES, ATOMIC ENERGY. LOTTERIES, GAMBLING, AGRICULTURE AND PLANTATIONS
20-49 Broadcasting.
26 Print media and news channels, defense, insurance, petroleum refining
49 Airlines, telecom, investment companies in infrastructure
51 Oil and gas pipelines, trading
51-100 Petroleum exploration74
74 Petroleum distribution, mining for diamonds, precious stones, coal, nuclear fuel, telecom, satellites, internet services, banking, advertising
74-100 Airports
100 All other areas

TABLE 3
Sectoral Composition of Foreign Direct Investment (August 1991 – November 2004)

Sector U.S. $ (billions) % of total
Electrical, electronics, and Software 3.8 15.1
Transportation 2.9 11.4
Telecommunications 2.7 10.5
Oil and electricity 2.5 9.8
Services 2.2 8.2
Chemicals 1.7 6.0
Food processing 1.1 4.2
Metals 0.5 1.9
Others 15.0 32.9
Total 32.3 100.0

India can only tinker with its infrastructure and cannot steamroll reforms, because it cannot ignore people at home who oppose its policies. As we shall see, this opposition applies to how India deals with its technology as well as to how it handles its political and religious conflicts. China has the luxury of not dealing with public opinion. Mountains are high and emperors are far away when it comes to making money, but the unitary state asserts itself if anyone disrupts what Beijing considers harmony. In India, adversity in the countryside can attract media attention and broad public outrage, which can be powerful enough to topple a ruling party.

China is overwhelmingly dependent on foreign capital (although as its savings mountain rises higher, less so), whereas in India, the domestic private sector, which has always existed, reinvests much of its retained earnings, and its domestic stock markets are relatively efficient at intermediating between savings and investments. As a result, annual flow of foreign direct investment (FDI) is not a good indicator of the Indian economy’s attractiveness: FDI inflow into India in 2005 was $6.6 billion; in China, the figure was $72.6 billion. But nobody thinks that China is 12 times more attractive than India. In fact, the investment bank Goldman Sachs now says that in the long run India will grow faster than China. India, which ranks 50th in world competitiveness indices, (China is 49th), has moved up five notches in recent years; China has fallen three notches, indicating a narrowing gap. The FDI Confidence Index, prepared by the consulting firm A.T. Kearney, which tracks investor confidence among global investors, ranks India as the world’s second-most desired destination for FDI after China, replacing the United States.

Vision 2020 Technology Priorities•Advanced Sensors (mechanical, chemical, magnetic, optic¸ and bio sensors)

Agro-food processing (cereals, milk, fruit and vegetables)

Chemical process industries (oil and gas, polymers, heavy chemicals, basic organic chemicals, fertilizers, pesticides, growth regulators, drugs and pharmaceuticals, leather chemicals, perfumes, flavors, coal).

Civil Aviation (airline operations, manufacture and maintenance, pilot training, airports)

Food and agriculture (resource management, crop improvement, biodiversity, crop diversification, animal sciences)

Electric power (generation, transmission and distribution), instrumentation and switchgear)

Electronics and communications (components, photonics, optoelectronics, computers, telematics, fiber systems, networking)

Engineering industries (foundry, forging, textile machinery)

Healthcare (infetious diseases, gastrointestinal diseases, genetic and degenerative diseases, diabetes, cardiovascular diseases, mental disorders, injuries, eye disorders, renal diseases, hypertension)

Materials and processing (mining, extraction, metals, alloys, composite and nuclear materials, bio materials, building materials, semiconductors)

Life sciences and biotechnology (healthcare, environment, agriculture)

Road transportation (design and materials, rural roads, machinery, metro systems)

Services (Financial services, travel and tourism, intellectual property rights)

Strategic Industries (aircraft, weather survey, radar, space communications, remote sensing, robotics)

Telecommunications (networks, switching)

Waterways (developing smart waterways)

Sectors that dominate foreign investment in India—software, electric products, electronic products, telecommunication, chemicals, pharmaceuticals and infrastructure— require highly skilled professional staff, and India’s sophistication in these sectors surprises many outside India. How could a country with more than 300 million illiterate people also have the kind of scientific human resources that bring some of the world’s largest corporations to base their R&D labs in India?

Today, GE and Microsoft are among many multinationals that have set up such units in India, tapping the skills of Indian engineers and scientists and patenting discoveries for commercial applications. According to the U.S. Patent and Trademark Office, Indian entities registered 341 U.S. patents in 2003 and had 1,164 pending applications, compared to a mere 54 applications ten years earlier. At home, there were 23,000 applications pending for Indian patents in 2005, up from 17,000 in 2004. Indian authorship of scientific papers also rose from 12,500 articles in the ISI Thomson database in 1999 to 15,600 in 2003.

Recapturing past glory

Saying that the 21st century will belong to India, Raghunatha Mashelkar, director-general of the Council for Scientific and Industrial Research (CSIR), India’s nodal science research institute, said: “India will become a unique intellectual and economic power to reckon with, recapturing all its glory, which it had in the millennia gone by.” The glory he is referring to is of the Indus Valley civilization (2500 BCE), which had developed a sewage system that was then unrivaled in the world. The mathematical concept of zero was invented in India in the first millennium, and many concepts in the decimal system and geometry were explored by Indian mathematicians. Its ancient medical science, ayurveda, is still practiced in India, and some accounts say that in 200 BCE Indians were perhaps the first in the world to smelt iron to make steel.

Capturing the rational impulse of science was a priority for India’s first prime minister, Jawaharlal Nehru, who governed India from 1947 to1964. He told his audiences he wanted India to cultivate “a scientific temper.” At independence, Nehru said: “Science alone … can solve the problems of hunger and poverty, of insanitation and illiteracy, of superstition and deadening customs.” For him, science would pave the way towards self-sufficiency, which was a cornerstone of his concept of national security. As a fan of the Soviet-style planned economy (India continues to produce five-year plans), Nehru saw great promise in a state-led industrial effort and invested significant resources to build a massive public sector. He called those steel plants and power plants “temples of modern India.”

Nehru’s thoughts continue to reverberate in speeches Indian leaders make. In the science policy the government issued in 2003, it broadened the aims of science, recognizing its “central role in raising the quality of life of the people … particularly the disadvantaged sections of the society.” Nehru’s grandson Rajiv Gandhi, who was prime minister between 1984 and 1989, instituted technology missions to identify and champion specific technologies and to bring the inventions in the labs to market, albeit guided by the state.

The current Indian president (a largely ceremonial post) is Abdul Kalam, a missile scientist who ran India’s elite Defense Research and Development Organization lab. In his speeches, he has regularly stressed scientific thinking, promoting innovation of technology to harness the power of science to achieve broader social and economic goals.

The major initiative in this regard is the Technology Information Forecasting Assessment Council (TIFAC), set up as an autonomous organization under the department of science and technology, chaired by R Chidambaram, a former chairman of India’s atomic energy commission. The council observes global technological trends and formulates preferred technology options for India. Its objectives include:

  • Undertaking technology assessment and forecasting studies in select areas of the economy;
  • Observing global trends and formulating options for India;
  • Promoting key technologies; and,
  • Providing information on technologies.

It has produced feasibility surveys, facilitated patent registration, and prepared two important documents: “Technology Vision 2020 for India” and “A Comprehensive Picture of Science and Technology in India.” The Vision 2020 project provided detailed studies on infrastructure, advanced technologies, and technologies with socioeconomic implications, and it identified key areas on which to focus (see box).

Planning or dreaming?

Listing goals is relatively easy. Does India have the skilled people to achieve them? Does it provide sufficient incentives for R&D? Which sectors are promising? How seriously should the world take the Indian challenge?

Although the quantity and quality of India’s scientific professionals are a matter of some dispute, there is no denying that the Indian Institutes of Technology (IITs) produce what a recent Duke University study calls “dynamic” (as against “transactional”) engineers. Indeed, the saga of the IITs encompasses much of what is forward looking and backward looking in India.

The first IIT was inaugurated by Nehru, who called the IIT “a fine monument of India, representing India’s urges, India’s future in the making.” There are now seven IITs in India, and many states are clamoring for more. But there are concerns about managing quality, and a shortage of faculty members is forcing some IITs to look overseas to recruit faculty. Retaining faculty is also hard when better-paying jobs are available in the private sector.

The IITs’ extremely harsh selection regime ensures that only the brightest make it. The seven IITs accept only about 4,000 students a year, about one of every 100 who apply. Microsoft chairman Bill Gates calls the IIT “an incredible institution that has really changed the world and has the potential to do even more in the years ahead.”

The IITs have undoubtedly been good for India. They have burnished India’s reputation and produced many talented graduates who have gone on to play a major role in a wide range of businesses. But at home they are criticized as elitist and an impediment to social goals. Some have pointed out that a large number of IIT graduates leave India and that many never return even though the state has subsidized their education significantly. Kirsten Bound, who recently wrote “India: The Uneven Innovator,” a study of India’s science and technology prowess for Demos, the British think tank, as part of a project mapping the new geography of science, described an IIT as “a departure lounge for the global knowledge economy.” Although it is true that some 70% of IIT graduates left India for much of the past 50 years, in recent years the figure has dropped to 30%, according to CSIR’s Mashelkar. Other education activists have complained that instead of lavishing its resources on the IITs, the state should invest more in primary education to tackle the problem of mass illiteracy. Some argue that the IITs should replace their strictly meritocratic admission system with a quota system that guarantees that all social groups are adequately represented.

Although IITs have produced CEOs of leading western multinationals, they are not known for original research. And unlike western universities, they are not known to be incubators of entrepreneurial ideas that spawn new businesses.

IIT faculty and alumni are aware of that and encourage greater innovation. A strong foundation of research is growing in India, but it is not coming from the universities.

The environment for R&D has been evolving slowly but steadily in India. After relaxing curbs on foreign investment in 1991, India agreed to comply with the TRIPS rules on intellectual property protection. As a developing country, India was allowed a five-year period of adjustment (1995-2000) and a further five-year extension for pharmaceuticals and agricultural chemicals. Meanwhile, it amended its copyright law to be consistent with the Bern convention on copyrights and became a member of the World Intellectual Property Organization.

Multinationals recognized these changes and began establishing R&D operations. Texas Instruments set up the first real western R&D center in 1985, and today about 150 companies have R&D centers in India, where they have invested more than $1 billion. A survey by PriceWaterhouseCoopers found that 35% of multinationals said they were likely to set up R&D centers in India, compared to 22% in China and only 12% in Russia.

The Demos study found that Texas Instruments, Oracle, and Adobe have developed complete products in India. Microsoft has 700 researchers on its rolls in Bangalore, making it the company’s third-largest lab outside of the United States. GE employs 2,300 employees in Bangalore, making it the company’s biggest R&D center in the world. Many of these employees are Indians returning from abroad. Jack Welch, then CEO of GE, who decided to set up the R&D unit in India, said at the time of the opening of the center: “India is a developing country, but it is a developed country as far as its intellectual infrastructure is concerned. We get the highest intellectual capital per dollar here.” The Microsoft experience, too, has been positive for the company. Its India lab works on digital geographics, hardware, communication systems, multilingual systems, rigorous software engineering, and cryptography. Its list of advisors comprises star faculty from the IITs.

The trouble for India is that this successful commercial R&D culture has taken root in India’s domestic industries. As India was setting its course for the future, it found itself in a peculiar position. On one hand, it had a political leadership committed to promoting science and technology, and it invested in elite institutions that produced thousands of graduates with cutting-edge skills. But those graduates and institutes simply could not make breakthroughs or develop technologies in which the markets had an interest. One formidable barrier was that the governing class’s deep distrust of the capitalist model, which resulted in punitive tax laws and other policy measures designed to prevent individuals from earning excessive financial gains from their innovations. Many of those with the talent and drive to innovate decided that India was not the place for them.

The result was that government came to dominate Indian R&D. The state spends $4.5 billion a year directly, and when one adds the amount spent by state-owned companies, the state’s share amounts to an overwhelming 85% of total R&D expenditures in the country. Private firms have argued that they have not invested in R&D in pre-liberalization India because they were prevented from reaping the economic rewards of innovation. Indeed, a survey of annual reports of 8,334 listed companies on Indian stock exhanges in 2003 by the Administrative Staff College of India found that 86% of Indian companies spent nothing on R&D. Even InfoSys, arguably one of the leading Indian software firms, spends only 1% of its annual revenue on R&D, and R&D spending is low among all the IT outsourcing firms.

This may seem surprising, given that the Indian software industry has shown enormous growth in recent years and now accounts for nearly 5% of India’s GDP. The number of Indians working in the sector has grown phenomenally too, from 284,000 in 1999 to 1.3 million last year. By next year, IT exports may account for one-third of India’s total exports. Yet despite this growth, thoughtful observers have pointed out that India’s transition from maintaining source codes to innovative work has been slow. There are few Indian shrink-wrapped software products, and comparatively little intellectual property.

The major reason that India’s science infrastructure is not related to markets is because the policy environment removes some of the incentives for the private sector to invest in innovation. The critical link between the lab, the venture capitalist, and the marketplace has not been forged. Instead, India’s government-run research system focuses primarily on basic science with little near-term commercial value or develops products that do not meet market needs. According to T.S. Gopi Rethinaraj, a nuclear engineer who teaches science, technology, and public policy at the National University of Singapore: “One common feature is the general disconnect from commercially relevant and competent products and services.”

Indications that India is beginning to change are emerging in the pharmaceutical industry. India accounts for one-sixth of the global market for pharmaceuticals, and Indian companies are achieving significant success with production of generic drugs for export. The strengthening of intellectual property protection is creating an environment in which the companies believe that they will be able to reap the benefits of their research investments. Dr. Reddy’s Labs, a leading domestic drug company, spends 15% of its revenues on R&D, and other firms are approaching that level. Total R&D spending by Indian pharmaceutical companies rose 300% in the first five years of this decade, and Indian companies have begun making more complex formulations. Indian government labs and private companies have become the leading holders of Indian patents. Industry leaders believe that they could have a considerable cost advantage in the R&D stage of drug development if they can create a network of labs to work together.

Although there is considerable excitement in India with so many western firms setting up R&D units, nationalist-minded Indians worry that the country will not benefit. Some nationalists argue that talented Indians are lured from government labs by the higher salaries at multinationals and that once plugged into the global economy, they lose interest in Indian challenges and issues. But supporters say it is good that multinationals are coming to India, because it keeps Indian talent at home. Many Indians now see each new investment as a vote of confidence in India, and political opposition, while loud, has slowed. Businesses now know that India is a good place to do R&D, and many perceive that it will become even more so in the future.

Still, the public policy debate continues. The IITs have begun offering their students help in understanding the patent process, but counterfeiting remains rife. By one estimate, three-quarters of the software used in India is pirated. Criticism of the strengthening of the Indian patent regime has been most vociferous from social activists, who fear that India’s millions of poor may now find it impossible to access lifesaving medicines. They worry that Indian companies that now supply many inexpensive generic drugs to nonprofit groups for use in Africa will abandon these products. One critic, Sujatha Byravan, executive director at the Council for Responsible Genetics in Cambridge, Massachusetts, writes: “Pressure from international and domestic pharma companies has produced legislation that will create a situation where sick people will end up paying much more than they now do for desperately-needed medicines. Ignoring the ramifications of the patent bill is disingenuous.” More pointedly, she says that the Indian scientific community has been serving the needs of only the Indian middle class, not the hundreds of millions who live in abject poverty. CSIR’s Mashelkar counters that Indian laws permit compulsory licensing of drugs deemed essential, make it very difficult for companies to win extensions of their patents, and allow companies to manufacture drugs for poor countries not capable of producing their own.

The debate will continue, but over time it appears that India will become a more hospitable place to do R&D and that it will eventually spread from the labs of the multinationals to India’s domestic companies.

The long and winding road

In spite of all the hopeful signs, many major problems persist in India: The country abounds with avoidable diseases; its trains remain overcrowded; its buses fall over cliffs; its bridges collapse; its water taps run dry (and much of what comes from the tap is not safe); and the electrical system often breaks down, in part because of the widespread theft of power by the rich and poor alike. And there is the problem of the 300 million-plus people who cannot read or write. Economist Lester Thurow has pointed out that mass illiteracy is the yoke that will prevent India from rising higher.

There has been progress, but the work is never done. In 1980, two-thirds of Indians had no formal schooling, a figure that dropped to two-fifths by 2000. But that leaves a very large number of people who cannot read or write. Still, a youthful population engenders hope. President Kalam said recently: “India, with its billion people, 30% of whom are in the youthful age group, is a veritable ocean of talent, much of which may be latent. Imagine the situation when the entire sea of talent is allowed to manifest itself.”

India’s dreams remain elusive, but they are worthy dreams. The country’s emergence as a possible source of technological innovation highlights its ambiguous relationship with influences from abroad. In the Indian political culture major transformations can happen only incrementally, and a government in faraway Delhi cannot afford to ignore the demands from the hinterland.

There is genuine commitment to the Gandhian idea of self-reliance and a preference for home-grown technology and products. But there is also keen interest in modernity. In India, the land of synthesis, tradition and modernity need not be in opposition. It was modern India’s founding father, Mohandas Gandhi, who said: “I do not want my house to be walled in on sides and my windows to be stuffed. I want the cultures of all lands to be blown about my house as freely as possible. But I refuse to be blown off my feet by any.”

Where the Engineers Are

Although there is widespread concern in the United States about the growing technological capacity of India and China, the nation actually has little reliable information about the future engineering workforce in these countries. U.S. political leaders prescribe remedies such as increasing U.S. engineering graduation rates to match the self-proclaimed rates of emerging competitors. Many leaders attribute the increasing momentum in outsourcing by U.S. companies to shortages of skilled workers and to weaknesses in the nation’s education systems, without fully understanding why companies outsource. Many people within and beyond government also do not seem to look ahead and realize that what could be outsourced next is research and design, and that the United States stands to lose its ability to “invent” the next big technologies.

At the Pratt School of Engineering of Duke University, we have been studying the impact of globalization on the engineering profession. Among our efforts, we have sought to assess the comparative engineering education of the United States and its major new competitors, India and China; identify the sources of current U.S. global advantages; explore the factors driving the U.S. trend toward outsourcing; and learn what the United States can do to keep its economic edge. We believe that the data we have obtained, though not exhaustive, represent the best information available and can help U.S. policymakers, business leaders, and educators chart future actions.

Assessing undergraduate engineering

Various articles in the popular media, speeches by policy-makers, and reports to Congress have stated that the United States graduates roughly 70,000 undergraduate engineers annually, whereas China graduates 600,000 and India 350,000. Even the National Academies and the U.S. Department of Education have cited these numbers. Such statements often conclude that because China and India collectively graduate 12 times more engineers than does the United States, the United States is in trouble. The remedy that typically follows is for the United States to graduate more engineers. Indeed, the Democrats in the House of Representatives in November 2005 proposed an Innovation Agenda that called for graduating 100,000 more engineers and scientists annually.

RATHER THAN TRYING TO MATCH THEIR DEMOGRAPHIC NUMBERS AND COST ADVANTAGES, THE UNITED STATES NEEDS TO FORCE COMPETITORS TO MATCH ITS ABILITY TO INNOVATE.

But we suspected that this information may not, in fact, be totally accurate. In an analysis of salary and employment data, we did not find any indication of a shortage of engineers in the United States. Also, we obtained anecdotal evidence from business executives doing business in India and China that indicated that those were the countries with shortages. To obtain better information about this issue, we embarked on a project to obtain comparable engineering graduation data from the United States, China, and India.

U.S. graduation statistics are readily available from the Department of Education’s National Center for Education Statistics. Extensive data on engineering education are also collected by the American Society for Engineering Education and the Engineering Workforce Commission. In order to collect similar data for China and India, we initially contacted more than 200 universities in China and 100 in India. Chinese universities readily provided aggregated data, but not detail. Some Indian universities shared comprehensive spreadsheets, but others claimed not to know how many engineering colleges were affiliated with their schools or lacked detail on graduation rates by major. In the case of China, we eventually obtained useful data from the Ministry of Education (MoE) and, most recently, from the China Education and Research Network (CERN). In India, we obtained data from the National Association of Software and Service Companies (NASSCOM) and the All India Council for Technical Education (AICTE).

What we learned was that no one was comparing apples to apples.

In China, the word “engineer” does not translate well into different dialects and has no standard definition. We were told that reports sent to the MoE from Chinese provinces did not count degrees in a consistent way. A motor mechanic or a technician could be considered an engineer, for example. Also, the numbers included all degrees related to information technology and to specialized fields such as shipbuilding. It seems that any bachelor’s degree with “engineering” in its title was included in the ministry’s statistics, regardless of the degree’s field or associated academic rigor. Ministry reports also included “short-cycle” degrees typically completed in two or three years, making them equivalent to associate degrees in the United States. Nearly half of China’s reported degrees fell into this category.

In India, data from NASSCOM were most useful. The group gathers information from diverse sources and then compares the data to validate projections and estimates. However, NASSCOM’s definition of engineer includes a wide variety of jobs in computer science and fields related to information technology, and no breakdown is available that precisely matches the U.S. definition of engineer, which generally requires at least four years of undergraduate education. Still, the group’s data provide the best comparison. Data from the three countries are presented in Table 1.

TABLE 1
Four-Year Bachelor’s Degrees in Engineering, Computer Science, and Information Technology Awarded from 1999 to 2004 in the United States, India, and China

  1999-2000 2000-2001 2001-2002 2002-2003 2003-2004 2004-2005
United States 108,750 114,241 121,263 134,406 137,437 133,854
India 82,107 109,376 129,000 139,000 170,000
China: MoE and CERN 282,610 361,270
China: MoE Yearbook 212,905 219,563 252,024 351,537 442,463 517,225

Note: Gray-highlighted data may be a substantial overestimate.

We believe that both sets of data from China presented in Table 1 are suspect, but they represent the best estimates available. The CERN numbers are likely to be closer to actual graduation rates but are available for only two years. The MoE numbers do, however, reflect a real trend—that graduation rates have increased dramatically in China.

To better understand the impact of the increases in gradation rates reported in China, we analyzed teacher/student ratios and numbers of colleges. As part of this effort, we visited several schools in China and met with several business executives and an official of the Communist Party.

The surge in engineering graduation rates can be traced to a series of top-down government policy changes that began in 1999. The goals of the changes were twofold: to transform science and engineering education from “elite education” to “mass education” by increasing enrollment, and to reduce engineering salaries. What we found is that even as enrollment in engineering programs has increased by more than 140% over the past five years, China has been decreasing its total number of technical schools and their associated teachers and staff. From 1999 to 2004, the number of technical schools fell from 4,098 to 2,884, and during that period the number of teachers and staff at these institutions fell by 24%. So graduation rate increases have been achieved by dramatically increasing class sizes.

We learned that only a few elite universities, such as Tsinghua and Fudan, had been allowed to lower enrollment rates after they noted serious quality problems as a result of increases they had made. The vast majority of Chinese universities complied with government directives to increase enrollment.

Our interviews with representatives of multinational and local technology companies revealed that they felt comfortable hiring graduates from only 10 to 15 universities across the country. The list of schools varied slightly from company to company, but all of the people we talked to agreed that the quality of engineering education dropped off drastically beyond those on the list. Demand for engineers from China’s top-tier universities is high, but employers complained that supply is limited.

At the same time, China’s National Development and Reform Commission reported in 2006 that 60% of that year’s university graduates would not be able to find work. In an effort to “fight” unemployment, some universities in China’s Anhui province are refusing to grant diplomas until potential graduates show proof of employment. The Chinese Ministry of Education announced on June 12, 2006, that it would begin to slow enrollment growth in higher education to keep it more in line with expected growth in the nation’s gross domestic product. Although Chinese graduation rates will continue to increase for a few years, while the last few high-enrollment classes make their way through the university system, we expect that the numbers of engineering graduates will eventually level off and may even decline.

In India, the growth in engineering education has been largely bottom-up and market-driven. There are a few regulatory bodies, such as the AICTE, that set limits on intake capacities, but the public education system is mired in politics and inefficiency. Current national debates focus on a demand for caste-based quotas for more than half of the available seats in public institutions.

Private enterprise has been India’s salvation. The nation has a growing number of private colleges and training institutions. Most of these face quality issues, but a few of them do provide good education. In 2004, India had 974 private engineering colleges, as compared with only 291 public and government institutions. New training centers have sprung up to address skills gaps that exist between companies’ needs and the capabilities of college graduates. NIIT, an international corporation that provides education and training in information technology in a number of countries, is the largest private training institute and runs more than 700 training centers across India. These centers serve corporations that need to train employees, as well as job seekers trying to break into the information technology industry. The company claims to serve as a “finishing school” for engineers.

Among the universities funded by the government, the Indian Institutes of Technology are best known and reputed to provide excellent education. But they graduate only a small percentage of India’s engineers. For example, during the 2002-2003 academic year, the institutes granted a total of 2,274 bachelor’s degrees, according to school officials. The quality of other universities varies greatly, but representatives of local companies and multinationals told us that they felt comfortable hiring the top graduates from most universities in India—unlike the situation in China. Even though the quality of graduates across all universities was inconsistent, corporate officials felt that with additional training, most graduates could become productive in a reasonable period.

Industry trends in outsourcing

Our research into engineering graduation rates raised many questions. We wondered, for example, about possible links between trends in education and the hiring practices and experiences of U.S. companies engaged in outsourcing. Were companies going offshore because of the superior education or skills of workers in China, India, or elsewhere, or because of a deficiency in U.S. workers? Would companies hire the large numbers of Chinese or Indian engineers graduating from two-or three-year technical programs? What were the relative strengths or weaknesses of engineering graduates when they joined multinationals? What skills would give U.S. graduates a greater advantage, and would offshoring continue even if they had these skills?

To answer some of these questions, we surveyed 58 U.S. corporations engaged in outsourcing engineering jobs. Our findings include:

Degree requirements. We were surprised that the majority of respondents said they did not mandate that job candidates possess a four-year engineering degree. Forty percent hired engineers with two- or three-year degrees, and an additional 17% said they would hire similar applicants if they had additional training or experience.

Engineering offshore. Forty-four percent of respondents said their company’s U.S. engineering jobs are more technical in nature than those sent abroad, 1% said their offshore engineering jobs are more technical in nature, and 33% said their jobs were equivalent. Thirty-seven percent said U.S. engineering employees are more productive, whereas 24% said U.S. and offshore engineering teams are equivalent in terms of productivity. Thirty-eight percent said their U.S. engineering employees produced higher-quality work, 1% said their company’s offshore engineering employees produced higher-quality work, and 40% said the groups were equal.

Engineering shortages in the United States. We asked several questions about company policies in hiring engineers to work in the United States. First, we asked about job acceptance rates, which are an indicator of the competition a company faces in recruiting staff. Acceptance rates of greater than 50% are generally considered good. Nearly one-half of the respondents had acceptance rates of 60% or higher. Twenty-one percent reported acceptance rates of 80 to 100%, and 26% of respondents reported 60 to 79% acceptance rates. Eighty percent said acceptance rates had stayed constant or increased over the past few years.

It is common in many industries to offer signing bonuses to encourage potential employees to accept a job offer. We found, however, that 88% of respondents to our survey did not offer signing bonuses to potential engineering employees or offered them to only a small percentage of their new hires. Another measure of skill supply is the amount of time it takes to fill a vacant position. Respondents to our survey reported that they were able to fill 80% of engineering jobs at their companies within four months. In other words, we found no indication of a shortage of engineers in the United States.

Reasons for going offshore. India and China are the top offshoring destinations, with Mexico in third place. The top reasons survey respondents cited for going offshore were salary and personnel savings, overhead cost savings, 24/7 continuous development cycles, access to new markets, and proximity to new markets.

Workforce issues. Given the graduation numbers we collected for China and India, we expected to hear that Indian corporations had difficulty hiring whereas Chinese companies did not. Surprisingly, 75% of respondents said India had an adequate to large supply of well-qualified entry-level engineers. Fifty-nine percent said the United States had an adequate supply, whereas 54% said this was the case in China.

Respondents said the disadvantages of hiring U.S. engineers were salary demands, limited supply of available people, and lack of industry experience. The disadvantages of hiring Chinese engineers included inadequate communication skills, visa restrictions, lack of proximity, inadequate experience, lack of loyalty, cultural differences, intellectual property concerns, and a limited “big-picture” mindset. The disadvantages of hiring Indian engineers included inadequate communication skills, lack of specific industry knowledge or domain experience, visa restrictions, lack of proximity, limited project management skills, high turnover rates, and cultural differences.

CHINA IS RACING AHEAD OF THE UNITED STATES AND INDIA IN ITS PRODUCTION OF ENGINEERING AND TECHNOLOGY PHD’S AND IN ITS ABILITY TO PERFORM

Respondents said the advantages of hiring U.S. engineers were strong communication skills, an understanding of U.S. industry, superior business acumen, strong education or training, strong technical skills, proximity to work centers, lack of cultural issues, and a sense of creativity and desire to challenge the status quo. The key advantage of hiring Chinese entry-level engineers was cost savings, whereas a few respondents cited strong education or training and a willingness to work long hours. Similarly, cost savings were cited as a major advantage of hiring Indian entry-level engineers, whereas other advantages were technical knowledge, English language skills, strong education or training, ability to learn quickly, and a strong work ethic.

Future of engineering offshore. The vast majority of respondents said the trend will continue, and their companies plan to send an even wider variety of jobs offshore. Only 5% said their overseas operations would stabilize or contract.

To complement our survey, we also met with senior executives of a number of U.S. multinationals, including IBM, Microsoft, Oracle, and GE in India and China. All of them talked of major successes, expressed satisfaction with the performance of their groups, and foresaw significant expansion. They said their companies were responding to the big opportunities in these rapidly growing markets. They expected that R&D would be moved closer to these growth markets and that their units would increasingly be catering to worldwide needs.

Graduate and postgraduate engineering education

Our interest in globalization also led us to look at the need for and production of engineers in the United States, China, and India who have advanced engineering or technology degrees or who have pursued postgraduate training in these areas. We traveled to China and India to meet with business executives and university officials and to collect data from a variety of sources.

The business executives said that for higher-level jobs in R&D, they preferred to hire graduates with master’s or PhD degrees. They did not mandate a PhD for research positions, and they said they often found many capable master’s-level graduates. Chinese executives said it was getting easier to hire master’s and PhD graduates, but Indian executives said it was getting harder. In both countries, they reported seeing an increasing number of expatriates returning home and bringing extensive knowledge and experience with them.

The deans and other university officials we met, especially those at top-level institutions, talked about the increasing demand they were seeing for their graduates and the shortages they were experiencing in hiring PhD graduates for faculty positions. They reported frequently having to compete with private industry and universities abroad for such graduates.

In our analysis of actual graduation data, we found that U.S. numbers were readily available from the Department of Education’s National Center for Education Statistics, the American Society for Engineering Education, and the Engineering Workforce Commission. For China and India, the picture was much different, as government officials maintained that little information on such issues is available. Still, we have accumulated some data.

During our trip to China, we were able to examine reports issued by the MoE on the state of education throughout the country. These reports detail degree production across a variety of disciplines, including engineering. Unfortunately, they offer no explanation as to how their statistics are tabulated. We believe that the data are gathered in inconsistent ways from the various Chinese provinces and that there are problems with how degrees are classified and their accreditation or quality. Although we consider the data suspect, they represent the best information available on Chinese education and allow valid inferences of trends.

Some MoE information is available online, but detailed data, including the production of engineering master’s and PhD graduates, are published only in the ministry’s Educational Statistical Yearbooks. These yearbooks generally are not permitted to leave China. In addition, the data are presented a year at a time and, in some cases, are available only in Chinese. In Beijing, with the help of local students, we combed government libraries and bookstores, searching for these publications. We ultimately were able to assemble 10 years’ worth of data on Chinese graduate engineering degrees.

To obtain graduate statistics for India, we traveled to Bangalore and New Delhi and visited NASSCOM, the AICTE, and the Ministry of Science and Technology and University Grants Commission. From the ministry we obtained useful information about PhD graduates. Obtaining data on master’s degree graduates proved much more difficult.

Although NASSCOM is considered to be an authority on India’s supply of engineering and technology talent, for master’s degree graduates it maintains data only on students who obtain a specialized degree in computer application. We obtained more data on master’s degree graduates from the AICTE, a government body that regulates university and college accreditation and determines how many students each institution may enroll in various disciplines. Each year, the body issues a report titled Growth in Technical Education that includes data on intake capacities. Current versions of the reports are readily available, but archives are difficult to obtain. The data in these reports are not published online, and paper versions of the reports rarely leave India. Our team met with a number of AICTE officials at a variety of venues to obtain physical copies of the reports covering 10 years. For various technical reasons, we could not use data from the reports directly, but we were able to adjust them statistically to obtain what we consider to be valid measurements. We validated our methodology with various AICTE representatives and academic deans.

An added complication with India’s master’s degree data is that students can pursue two different master’s degrees within engineering, but graduates are often counted together. The first is a traditional technical master’s degree in engineering, computer science, or information technology. These degrees, which require two years of study, are similar in structure to master’s degree offerings in the United States and China. The second is a master’s of computer application (MCA) degree, a three-year degree that offers a foundation in computer science to individuals who previously had received a bachelor’s degree in a different field. Most MCA recipients receive an education equivalent to a bachelor’s degree in computer science. For our analysis, we included statistics on MCA degrees but separated them analytically from more traditional master’s degrees.

Table 2 shows our comparative findings related to master’s degrees, and Table 3 shows our findings related to PhD degrees.

TABLE 2
Ten-Year Trend in Engineering and Technology Master’s Degrees in the United States, China, and India (Actual and Estimated Data)

Note: 2001-02 Chinese data (hashed line) from the Ministry of Education represent a significant outlier and thus were removed from our analysis.

TABLE 3
Ten-Year Trend in Engineering and Technology PhD Degrees in the United States, China, and India

Note: 2001-02 Chinese data (hashed line) from the Ministry of Education represent a significant outlier and were removed from our analysis.

In the United States, close to 60% of engineering PhD degrees awarded annually are currently earned by foreign nationals, according to data from the American Society for Engineering Education. Indian and Chinese students are the dominant foreign student groups. Data for 2005 that we obtained from the Chinese government show that 30% of all Chinese students studying abroad returned home after their education, and various sources report that this number is steadily increasing. Our interviews with business executives in India and China confirmed this trend.

The bottom line is that China is racing ahead of the United States and India in its production of engineering and technology PhD’s and in its ability to perform basic research. India is in particularly bad shape, as it does not appear to be producing the numbers of PhD’s needed even to staff its growing universities.

Immigrants provide entrepreneurial advantages

Although our research has revealed some issues of concern for the United States, we also want to focus on what we consider to be the country’s advantages in today’s increasingly globalized economy. We believe that these advantages include the United States’ open and inclusive society and its ability to attract the world’s best and brightest. Therefore, we have studied the economic and intellectual contribution of students who came to the United States to major in engineering and technology and ended up staying, as well as immigrants who gained entry based on their skills.

Economic contributions. In 1999, AnnaLee Saxenian of the University of California, Berkeley, published a study showing that foreign-born scientists and engineers were generating new jobs and wealth for the California economy. But she focused on Silicon Valley, and this was before the dotcom bust. To quantify the economic contribution of skilled immigrants, we set out to update her research and look at the entire nation. She assisted us with our research.

We examined engineering and technology companies founded from 1995 to 2005. Our objective was to determine whether their chief executive officer or chief technologist was a first-generation immigrant and, if so, the country of his or her origin. We made telephone contacts with 2,054 companies. Overall, we found that the trend that Saxenian documented in Silicon Valley had become a nationwide phenomenon:

  • In 25.3% of the companies, at least one key founder was foreign-born. In the semiconductor industry, the percentage was 35.2%.
  • Nationwide, these immigrant-founded companies produced $52 billion in sales and employed 450,000 workers in 2005.
  • Almost 80% of immigrant-founded companies were within two industry fields: software and innovation/manufacturing-related services. Immigrants were least likely to start companies in the defense/aerospace and environmental industries.
  • Indians have founded more engineering and technology companies during that past decade than immigrants from Britain, China, Taiwan, and Japan combined. Of all immigrant-founded companies, 26% have Indian founders.
  • The mix of immigrants varies by state. For example, Indians dominate in New Jersey, with 47% of all immigrant-founded startups. Hispanics are the dominant group in Florida, and Israelis are the largest founding group in Massachusetts.

Intellectual contribution. To quantify intellectual contribution, we analyzed patents applications by U.S. residents in the World Intellectual Property Organization patent databases. Foreign nationals residing in the United States were named as inventors or co-inventors in 24.2% of the patent applications filed from the United States in 2006, up from 7.3% in 1998. This number does not include foreign nationals who became citizens before filing a patent. The Chinese were the largest group, followed by Indians, Canadians, and British. Immigrant filers contributed more theoretical, computational, and practical patents than patents in mechanical, structural, or traditional engineering.

Overall, the results show that immigrants are increasingly fueling the growth of U.S. engineering and technology businesses. Of these immigrants groups, Indians are leading the charge in starting new businesses, and Chinese create the most intellectual property.

We have been researching this issue further. Preliminary results show that it is the education level of the individuals who make it to the United States that differentiates them. The vast majority of immigrant founders have master’s and PhD degrees in math- and science-related fields. The majority of these immigrant entrepreneurs entered the United States to study and stayed after graduation. We expect to publish detailed findings this summer.

Informing national decisions

The findings of our studies can help inform discussions now under way on how best to strengthen the nation’s competitiveness. The solutions that are most commonly prescribed are to improve education from kindergarten through high school and especially to add a greater focus on math and science; increase the number of engineers that U.S. colleges and universities graduate; increase investments in basic research; and expand the number of visas (called H1B’s) for skilled immigrants.

Improving education is critical. As we have seen from the success of skilled immigrants, more education in math and science leads to greater innovation and economic growth. There is little doubt that there are problems with K-12 education and that U.S. schools do not teach children enough math and science. However, the degradation in math and science education happened over a generation. Even if the nation did everything that is needed, it will probably take 10 to 15 years before major benefits become apparent. Given the pace at which globalization is happening, by that time the United States would have lost its global competitive edge. The nation cannot wait for education to set matters right.

Even though better-educated students will be better suited to take their places in the nation’s increasingly technology-driven economy, education is not the sole answer. Our research shows that companies are not moving abroad because of a deficiency in U.S. education or the quality of U.S. workers. Rather, they are doing what gives them economic and competitive advantage. It is cheaper for them to move certain engineering jobs overseas and to locate their R&D operations closer to growth markets. There are serious deficiencies in engineering graduates from Indian and Chinese schools. Yet the trend is building momentum despite these weaknesses. The government and industry need to pay attention to this issue and work to identify ways to strengthen U.S. industry while also taking advantages of the benefits offered by globalization.

The calls to graduate more engineers do not focus on any field of engineering or identify any specific need. Graduating more engineers just because India and China graduate more than the United States does is likely to create unemployment and erode engineering salaries. One of the biggest challenges for the engineering profession today is that engineers’ salaries are not competitive with those of other highly trained professionals: It makes more financial sense for a top engineering student to become an investment banker than an engineer. This cannot be fixed directly by the government. But one interesting possibility can be seen in China, where researchers who publish their work in international journals are accorded status as national heroes. U.S. society could certainly offer engineers more respect and recognition.

A key problem is that the United States lacks enough native students completing master’s and PhD degrees. The nation cannot continue to depend on India and China to supply such graduates. As their economies improve, it will be increasingly lucrative for students to return home. Perhaps the United States needs to learn from India and China, which offer deep subsidies for their master’s and PhD programs. It is not clear whether such higher education is cost-justified for U.S. students. Given the exorbitant fees they must pay to complete a master’s and the long period it takes to complete a PhD, the economics may not always make sense.

It is clear that skilled immigrants bring a lot to the United States: They contribute to the economy, create jobs, and lead innovation. H1B’s are temporary visas and come with many restrictions. If the nation truly needs workers with special skills, it should make them welcome by providing them with permanent resident status. Temporary workers cannot start businesses, and the nation currently is not giving them the opportunity to integrate into society and help the United States compete globally. We must also make it easier for foreign students to stay after they graduate.

Finally, the United States does need to increase—significantly—its investment in research. The nation needs Sputnik-like programs to solve a variety of critical problems: developing alternative fuels, reducing global warming, eliminating hunger, and treating and preventing disease. Engineers, scientists, mathematicians, and their associated colleagues have vital roles to play in such efforts. The nation—government, business, education, and society—needs to develop the road maps, create the excitement, and make it really cool and rewarding to become a scientist or engineer.