Retooling Farm Policy
Federal programs to help farmers should be realigned so that they effectively advance their stated goals.
In 2000, federal direct payments to U.S. farmers exceeded $22 billion. Farm groups contend that as much as an extra $117 billion will be needed over the next 10 years to expand current farm programs. Under a new congressional budget proposal, an extra $79 billion would be committed to agriculture: $5.5 billion to address farmers’ income shortfalls in 2001 and $73.5 billion to provide support that could be used whenever needed through 2011.
These proposed payments are the latest in a decades-long tradition of farm support. They are associated with legislative goals that have been well accepted, if not applauded, by the American public. Goals that have been articulated in food and agricultural legislation since the 1930s focus on maintaining farm income, stabilizing consumer prices, and ensuring adequate supplies of commodities at reasonable prices. More recently, the improved environmental performance of agriculture has taken a prominent role in farm bills. And always, there is a presumption, if not an explicit recognition, of the goal of saving the family farmer.
The goals of farm legislation have not changed much in the past 60 years. But just about everything else concerning food and agriculture has changed –dramatically. With the most recent farm act of 1996 expiring in 2002, the time is ripe to examine the various farm policy goals and the extent to which they appear to be met through federal aid to farmers.
Farm commodity support programs began under the leadership of President Franklin Roosevelt’s Secretary of Agriculture, Henry A. Wallace, as part of the New Deal economic assistance package. At that time, the majority of Americans lived in rural areas; more than one quarter of all American families engaged in farming; and the extractive industries of farming, forestry, and mining were the very foundation of rural economies. Furthermore, farm households were, on average, much poorer than the general population. Under these conditions, it would be expected that income transferred to farmers would have ripple effects throughout the economy. The purchasing power of farming families would be strengthened, an abundant supply of food and fiber at “fair and reasonable prices” would be ensured for depression-era consumers, and the viability of rural economies would be preserved. The transfers were relatively progressive (or at least not terribly regressive) because the size of U.S. farms did not for the most part vary widely, and eligibility for farm support was almost universal because it was geared to the production or prices of commodities that most farmers raised.
Today, very few of these conditions apply. Less than 3 percent of the U.S. labor force engages in farming. Farm families make up less than 10 percent of the rural population, and more than three-quarters of rural counties derive more than 80 percent of their income from non-farm-related businesses and services. In addition, because of specialization and concentration, the character of the farm sector has changed dramatically. Whereas farms in the past tended to be diversified operations, a majority of today’s farms specialize in one or a few related commodities. There are 4 million fewer farms now than in the 1930s, though the amount of land being farmed has remained fairly constant. More important, production is skewed toward the very largest of the large farms: Fewer than 10 percent of all farms account for two-thirds of the commercial value of U.S. farm production.
The 1996 farm act was originally seen by many as a way to reduce the dependence of U.S. farms on government subsidies and to better orient agricultural production to market forces. Under the act, farm payments were disassociated from the production of specific commodities. Producers who had historically received payments would still receive them, but the amount would decline over a seven-year period. By 2002, the story went, farmers would be weaned from government subsidies and become more competitive in global markets as a result. But this story line never played out.
As commodity prices declined, the political will to continue to wean farmers faded. A series of “emergency” and “disaster” payments brought farm payment levels steadily up. Congress authorized more than $56 billion in direct payments to the farm sector between 1998 and 2000, and the distribution of payments continued to be skewed toward the producers of specific, historically payment-dependent commodities.
Who gets the dough?
Well over one million of America’s two million farms receive no government payment whatsoever. In recent years, as total payments have reached record levels, they have been distributed to fewer than 40 percent of all farmers. Indeed, most farmers are no longer automatically eligible for subsidies. As farms have become more highly specialized and products more highly differentiated, continued reliance on production of a limited number of field crops as the basis for distributing commodity-based subsidies means that fewer farmers are eligible for that type of payment. Conservation and environmental payments are broadly available on lands from which environmental benefits can be expected, but they make up only about 20 percent of all payments. Not all payments go to farmers. In 2000, nonoperator landlords received an estimated 12 to 15 percent of all direct government payments.
Classifying farms on the basis of their size and type provides a closer look at how farm payments are distributed. (The box on the previous page describes a typology that splits U.S. farms into relatively homogeneous groups for purposes of policy evaluation. Figure 1 shows the distribution of 1998 farm program payments across these classes of farms.) How well does this distribution pattern achieve the farm policy goals that appear to be popular with the American public and get the most attention from legislators?
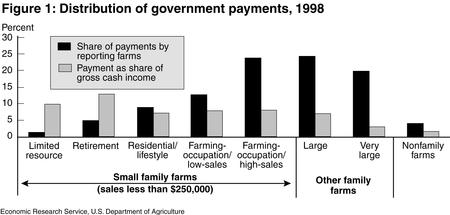
Larger farms receive a disproportionate share of payments relative to their numbers. In 1998, the largest 8 percent of farms (those with annual sales exceeding $250,000) received 47 percent of all federal payments. These farms tend to specialize in cash grains, whereas limited-resource, retirement, residential, and smaller commercial farms are less likely to produce crops on which payments have traditionally been based.
The smaller proportion of payments that do go to small farms is more heavily concentrated on conservation payments, particularly payments made under the Conservation Reserve Program (CRP). In fact, for retirement farms in 1998, CRP payments represented a substantial portion of total farm income.
Most telling, though, is the fact that the beneficial effects of government payments appear to be even more skewed across different types of farms and farm households than have the payments themselves. In a particularly revealing piece of analysis, U.S. Department of Agriculture (USDA) economist Jeffrey Hopkins examined profits and household incomes on farms that did and did not receive farm payments in 1999. He found that direct payments boosted farm financial returns disproportionately for farms that had very low and very high rates of return relative to other farms. In the upper third of the farm profit distribution, including those farms that would have shown a profit even in the absence of payments, the effect of payments on profits was high. The profits of farms in between the extremes were less affected by farm payments, averaging only about a 2 percent increase in rates of return because of government payments. A similar pattern was revealed for the effect of government payments on the well being of farm households. Although current farm payments do, indeed, improve the financial standing of the worst-off farm program participants, they have not been sufficient to push financially stressed farm households above the poverty line.
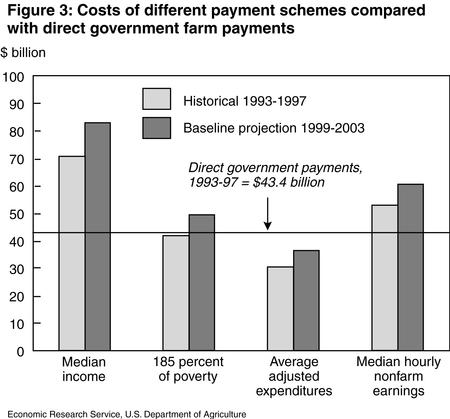
To answer the question of how payments would best be distributed to provide a hedge against poverty for farm households, USDA’s Economic Research Service (ERS) examined four scenarios for government assistance to agriculture, based on the concept of ensuring farm families some minimum standard of living. Using other federal assistance programs for low-to-moderate income households as a guide, this research asked how much federal funding would be required and how that funding would be distributed in order to ensure that farm household income would be equal to (a) the median nonfarm household income in the same region; (b) 185 percent of the poverty line (the basis for most child nutrition assistance programs); (c) the average nonfarm household’s annual expenditures; or (d) income earned at the median hourly rate of earnings of the nonfarm self-employed (about $10 per hour).
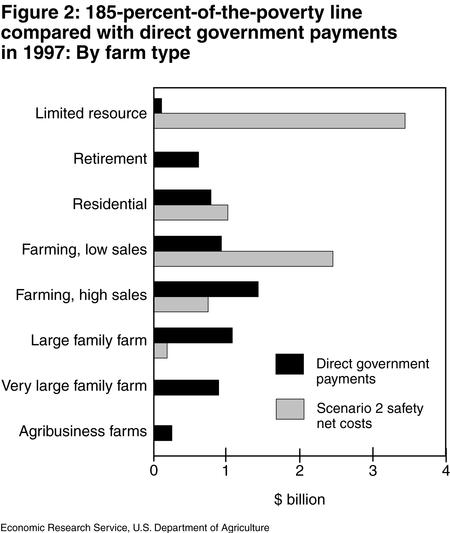
Not surprisingly, each of the four scenarios presents a pattern of government payment distribution in which payments are skewed in the opposite direction of current payments. Under a real safety net, lower-income farmers with small farms benefit more than farmers with large farms. Figure 2 shows just how dramatic the difference in payment distribution would have been in 1997 had a poverty line standard been used instead of the traditional basis. Furthermore, for two of the scenarios examined, total direct government payments would have been less to achieve the specific safety net goal than the total spent (partly in the name of safety net provision) for actual programs between1993 and 1997 (Figure 3).
Farm versus rural income
It is hard for rural America to get much out of farm payments when farming and farm-related businesses are themselves minor contributors to rural economic health. And this is decidedly the case for rural America in 2001. The average farming share of local personal income in rural counties in the United States fell to under 6 percent in the early 1980s, and has hovered between 4 and 6 percent ever since. Clearly, farming is no longer the dominant source of jobs or income in most rural counties that it was 50 years ago.
Still, there are areas of the country that remain dependent on farming. Farming contributes at least 10 percent of county-earned income in about one-fourth of rural counties clustered largely in the Plains. These are the communities likely to be affected most by changes in the farm economy.
Indeed, federal commodity program payments have historically played an important role in the farm economy of these farming-reliant rural areas. Modest economic effects are still apparent. But they are not acting and cannot act as the basis for supporting rural economic development. The reasons for this apparently counterintuitive conclusion lie in technological advance and farmland ownership patterns. Technology has allowed more and more output to be produced per unit of land and unit of labor; one farm family can farm significantly more land than was possible 50 years ago. As a consequence, a concentrated number of people receive farm payments, even in farming-dependent counties. What’s more, research has shown that much of the value of those payments to a minority of residents leaks out of the local area because business dealings with firms farther away have become more feasible.
A plethora of evidence exists to show that rural community development is best served by investment in housing, education, other social services, and job creation in industries for which the area is well suited, be that tourism and recreation, services, or manufacturing. Agriculture does not have good job-creation potential because it is increasingly capital intensive. Interestingly, though, farm household welfare is very well served by the creation of nonfarm job opportunities. This is because, like other U.S. households, a majority of family farm households have diversified their earning sources, using off-farm income as a buffer against swings in the farm economy. So not only is nonfarm investment better than direct farm payments in facilitating rural economic development, nonfarm rural job creation is also more key to the long-term survival of many family farms than government payments can be if those payments’ distributional patterns mimic the present.
Greening farm policy
Conservation goals have been included as a part of farm policy since the 1930s. It has only been recently, however, that environmental quality has been seriously discussed as a potential basis for farm income support. This approach, some argue, would provide a more transparent and publicly acceptable basis, as well as one that is consistent with policy reforms agreed to under the World Trade Organization, for domestic farm support.
For environmental payments to act efficiently as a vehicle for farm income support, there must be good congruence between where small and financially vulnerable farms are located and where agricultural activity poses particular hazards or provides particular benefits to the natural environment. That congruence exists to different degrees, depending upon the specific environmental problem to be tackled. For example, only about 20 percent of small and moderately unprofitable farms make reasonable targets for improvements in nitrogen runoff, but two-thirds to three-fourths of those farms are in areas where rainfall erosion is an agri-environmental problem. In the aggregate, some 20 percent of small and moderately unprofitable farms fall outside of areas where farming poses specifically identified major environmental problems. Still, if farm support payments were distributed strictly according to a bundle of varied indicators of environmental need, they could meet farm safety net goals as well or better than current programs. Like a move to real safety net program options, however, a move toward a “green” basis for farm income support would imply substantial change in exactly who gets the payments.
For example, consider the difference between the geographic distribution of current farm program payments and geographic indicators for estimated water quality damage from soil erosion. Whereas current farm payments are especially concentrated in the plains states, water quality damage from erosion, a major agri-environmental problem, is much more concentrated near coastal areas, and in the Southwest, upper Mississippi River valley, and Southeast. In general, the value of the benefits of tackling agri-environmental problems are greater in areas of population density (because there are more “consumers” of environmental quality there) than in the relatively sparser rural areas where most large farms are found. However, the more environmental goals included as the basis for “green” farm payments, the greater the number of farmers who could qualify for payments regardless of location.
It can be convincingly argued that farm policy need not incorporate environmental enhancement, rural community development, or social engineering to keep farms small (although all of these goals do play a large part in farm policy rhetoric), because other policy instruments are available to accomplish those goals. But the oft-articulated goals of agricultural competitiveness and an abundant supply of food and fiber at reasonable prices would, from the policy purist’s perspective, be better achieved by a sectoral farm policy that focuses on supporting the efficiency of the food and agricultural system.
Whether or not one agrees with efficiency as a primary policy goal, it turns out that it is not a goal well achieved by current farm program payments. The long history of government support of particular farming activities has led to a phenomenon whereby farmland owners and the financial institutions that serve them receive the lion’s share of the program benefits. Farmland values reflect, in part, the present value of the expected future stream of benefits from farming the land. If expectations include continued farm payments from the government, distributed according to historical patterns, then those payments become “capitalized” into land values. Land values are higher than they would be in the absence of past, present, and expected future payments.
Payments translate into higher land rental rates for the 40 to 45 percent of farmers who rent at least some of the land they farm. Higher land rental rates mean higher costs of production. They induce a different response to market forces than would be the case if they were at normal levels, manifesting in decreased efficiency and lowered competitiveness of U.S. agriculture.
Further, farmland owners may not be operators. If nonoperator farmland owners capture the higher rents or land values, then any safety net and rural development goals of farm policy can also be thwarted. The payments may not just seep out of the community, they may wind up in the hands of retired owners of farmland in, say, Florida.
Unarguably, the payments distributed under agricultural legislation during the last decade have aided a number of farm households, saved some family farms, and added to rural economies’ health. Just as certainly, payments haven’t achieved any such goals effectively in the aggregate. They have not been skewed toward farm households in financial straits. Their overcapitalization in land interferes with the efficient functioning of the U.S. agricultural economy. And although targeted direct payment programs such as CRP have achieved environmental quality goals, this enhancement has occurred to a lesser degree and in a more ad hoc manner than could be accomplished with the same or even lower payment levels. If one were to recraft farm payment programs to accomplish any one of the farm safety net, rural economic development, agri-environmental, farm structure, or economic efficiency goals posited here, the result would be a payment distribution pattern that differs radically from the present pattern.
The broken promises of farm payment distribution suggest several guiding principles for the upcoming farm bill debate. First, explicit articulation of the real underlying goals of farm legislation would prevent the confusion created by platitudinous rhetoric about virtuous but not virtual goals. If the federal budget becomes tighter, this confusion can turn to disenchantment with farm programs in general. An American public demanding more services from the federal government and aware of the fact that billions of dollars in farm payments are not doing what they have been told they would do won’t be sympathetic to future calls for farm support. No doubt it would be quite awkward for legislators to state the goal as “maintaining vested interests,” but that is the goal suggested by current payment patterns.
It might be argued that current payments do not meet any one goal well because they are directed at accomplishing multiple goals. Although it would not necessarily be easy to support this argument, its contention could be addressed by a second (and well-worn) guiding principle for the new farm bill: Employ a unique policy instrument for each policy goal. For example, rather than attempting, futilely, to design a farmland-based payment program that both improves environmental quality and supports grain farmers’ incomes, craft a green payments program for the environmental goal and a safety net program for grain producers. Use rural development rather than farm payment programs to improve economic vitality in rural areas.
Finally, target, target, target. If one really wants to save financially vulnerable farms, payment schemes must be targeted to the precise subpopulation of farmers that fit the criteria that justify rescue. Or, if a land-based environmental improvement is a payment program’s goal, payment schemes must be geographically targeted.
As we approach 2002, the farm bill debate is bound to heat up. Whether it generates real reform or more hot air is yet to be seen. For those who care about the purported goals of U.S farm support, this is the right time to ask, “Who will benefit from proposed alternatives?”
FARM TYPOLOGY GROUP DEFINITIONS
SMALL FAMILY FARMS
(sales less than $250,000)
- Limited-resource farms. Small farms with sales less than $100,000, farm assets less than $150,000, and total operator household income less than $20,000. Operators may report any major occupation, except hired manager.
- Retirement farms. Small farms whose operators report they are retired.*
- Residential/lifestyle farms. Small farms whose operators report a major occupation other than farming.*
- Farming-occupation farms. Small farms whose operators report farming as their major occuation.*
- Low-sales farms. Sales less than $100,000.
- High-sales farms. Sales between $100,000 and $249,999.
OTHER FARMS
- Large family farms. Sales between $250,000 and $499,999.
- Very large family farms. Sales of $500,000 or more.
- Nonfamily farms. Farms organized as nonfamily corporations or cooperatives, as well as farms operated by hired managers.
*Excludes limited-resource farms whose operators report this occupation.